TopPodcast.com
Menu
  • Home
  • Top Charts
  • Top Networks
  • Top Apps
  • Top Independents
  • Top Podfluencers
  • Top Picks
    • Top Business Podcasts
    • Top True Crime Podcasts
    • Top Finance Podcasts
    • Top Comedy Podcasts
    • Top Music Podcasts
    • Top Womens Podcasts
    • Top Kids Podcasts
    • Top Sports Podcasts
    • Top News Podcasts
    • Top Tech Podcasts
    • Top Crypto Podcasts
    • Top Entrepreneurial Podcasts
    • Top Fantasy Sports Podcasts
    • Top Political Podcasts
    • Top Science Podcasts
    • Top Self Help Podcasts
    • Top Sports Betting Podcasts
    • Top Stocks Podcasts
  • Podcast News
  • About Us
  • Podcast Advertising
  • Contact
Not in our directory?
Add Show Here
Podcast Equipment
Center

toppodcastlogoOur TOPPODCAST Picks

  • Comedy
  • Crypto
  • Sports
  • News
  • Politics
  • True Crime
  • Business
  • Finance

Follow Us

toppodcastlogoStay Connected

    View Top 200 Chart
    Back to Rankings Page
    Technology

    StorageReview.com

    StorageReview.com is a leading provider of news and reviews throughout the entire IT stack – from the datacenter to the edge, and all points in between.

    Advertise
    • Apple Podcasts
    • Google Play
    • Spotify

    Latest Episodes:
    AMD Posts the Full EPYC 9006 SKU List: 31 Venice Parts From $700 to $14,904 Across SP7 and SP8 Sep 26, 2026
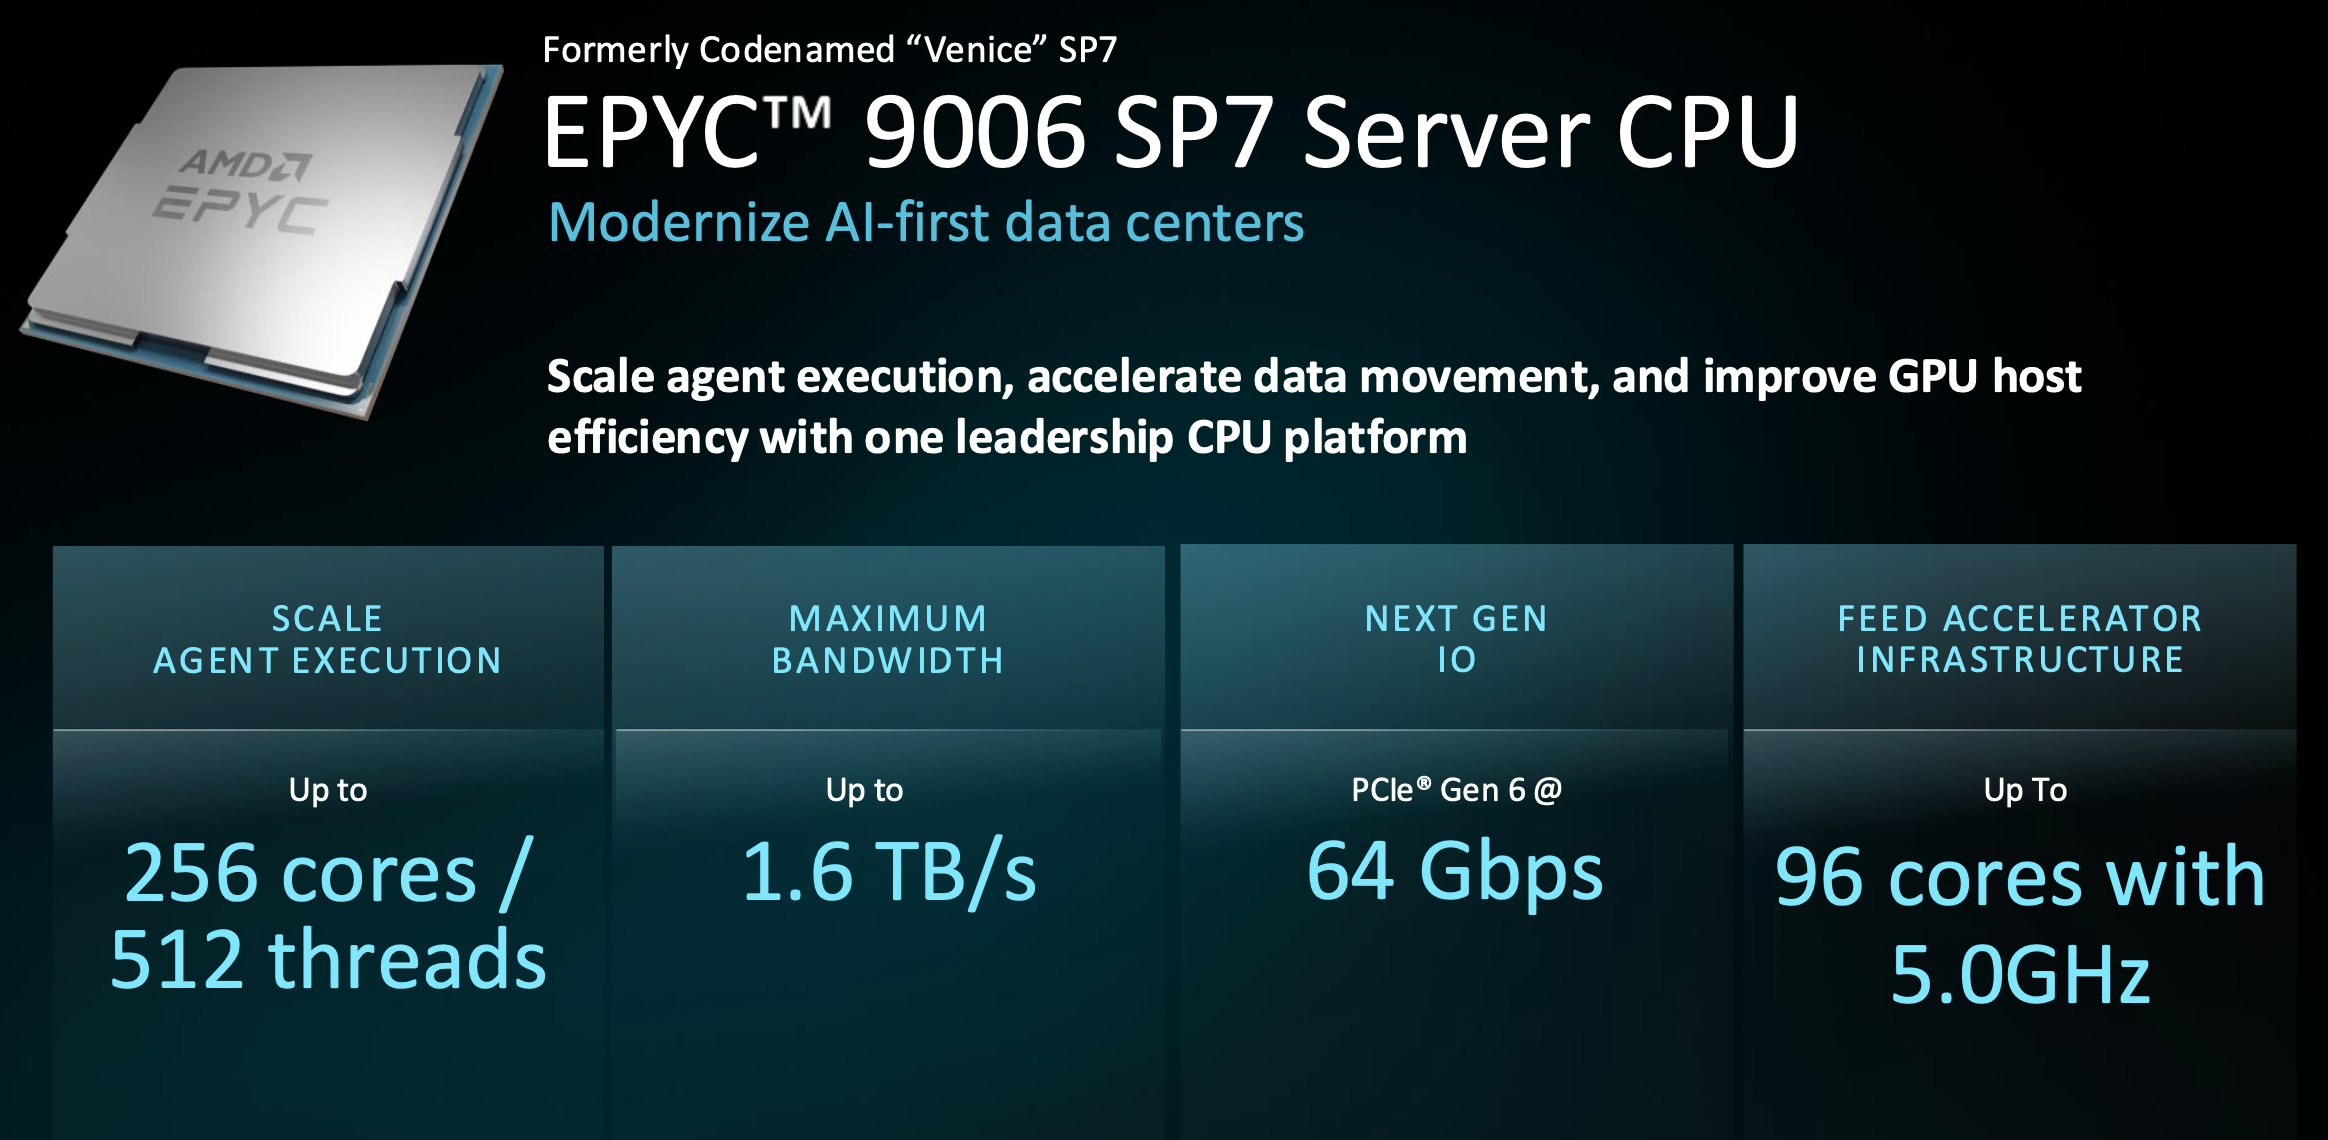
    Show notes AMD EPYC 9006 SP7 launch slide listing up to 256 cores and 512 threads, up to 1.6 TB/s memory bandwidth, PCIe Gen 6 at 64 Gbps, and up to 96 cores at 5.0GHz for accelerator hosts AMD EPYC 9006 SP7 launch slide listing up to 256 cores and 512 threads, up to 1.6 TB/s memory bandwidth, PCIe Gen 6 at 64 Gbps, and up to 96 cores at 5.0GHz for accelerator hosts

    AMD has posted the full SKU list for its 6th Gen EPYC 9006 series, the Zen 6 parts it launched as Venice at Advancing AI 2026 in July, and all of the processors offer 1Ku pricing guidance. There are 31 parts across the two sockets: nine for SP7, the 16-channel flagship platform, running from a 64-core CPU at $8,008 to the 256-core EPYC 9996 at $14,904, and 22 for SP8, the 8-channel enterprise socket, running from an 8-core EPYC 9016 at $700 to a 128-core EPYC 9746 at $11,679. AMD marks the list as subject to change, and the platform timing from July still stands: SP7 systems in the fourth quarter of this year, SP8 systems in the first half of 2027.

    AMD EPYC 9006 SP7 launch slide listing up to 256 cores and 512 threads, up to 1.6 TB/s memory bandwidth, PCIe Gen 6 at 64 Gbps, and up to 96 cores at 5.0GHz for accelerator hosts

    The naming carries over from Turin, so the first digit is the series, the middle digits track relative performance, the last digit is the generation, and the suffix tells you the bin: an F is a high-frequency part with a 5GHz boost, a P is single-socket only, and no suffix means a standard 1P or 2P part. One new label appears in the SP7 list: the EPYC 9G76, which is the host processor AMD builds into every Helios compute tray, now listed as an orderable part. AMD has also retired TDP as its power label; the product pages use “Default CPU Power,” which AMD defines as the total power consumed across the compute and I/O dies for the stated performance target, with a configurable range beside it.

    SP7: 9 Parts From 64 to 256 Cores

    Every SP7 part is a 1P or 2P processor with 16 channels of DDR5, rated at 1,024GB/s per socket with 8,000 MT/s RDIMMs and 1,638GB/s with 12,800 MT/s MRDIMMs, and AMD’s product pages list PCIe 6.0 x96 for the socket. Zen 6c carries core counts above 96; the standard Zen 6 core carries the 5GHz bins, and the 96-core tier is split three ways.

    Model Cores / Threads Base Clock Max Boost L3 Cache Default CPU Power (Range) Sockets 1Ku Price
    EPYC 9996 256 / 512 2.55 GHz 4.1 GHz 1024MB 600W (400W-600W) 1P / 2P $14,904
    EPYC 9966 192 / 384 2.9 GHz 4 GHz 768MB 600W (400W-600W) 1P / 2P $14,079
    EPYC 9846 168 / 336 2.85 GHz 3.7 GHz 768MB 500W (320W-500W) 1P / 2P $13,114
    EPYC 9756 128 / 256 3.15 GHz 4 GHz 512MB 500W (320W-500W) 1P / 2P $12,498
    EPYC 9G76 96 / 192 3.4 GHz 4.8 GHz 384MB 500W (320W-500W) 1P / 2P $11,622
    EPYC 9686F 96 / 192 3.4 GHz 5 GHz 384MB 500W (400W-600W) 1P / 2P $11,434
    EPYC 9656 96 / 192 3.05 GHz 3.7 GHz 512MB 400W (220W-400W) 1P / 2P $9,713
    EPYC 9586F 64 / 128 3.75 GHz 5 GHz 384MB 500W (400W-600W) 1P / 2P $9,701
    EPYC 9556 64 / 128 2.75 GHz 4.3 GHz 384MB 300W (220W-300W) 1P / 2P $8,008

    The 256-core EPYC 9996 sits at $14,904, the same figure AMD used in its July SPECrate comparison against Intel’s 128-core Xeon 6980P at $13,955, and it keeps 4MB of L3 per core with 1,024MB on the package. Each step down the density ladder costs less in total and more per core: the 192-core 9966 is $14,079, the 168-core 9846 is $13,114, and the 128-core 9756 is $12,498, which puts the flagship at $58 per core and the 9756 at $98. Two SKUs from the launch materials are worth noting. The 256-core EPYC 9956 at 400W, which AMD used in its rack-density endnotes in July, is not in the published list, and the 9G76 is, at $11,622 for 96 cores, a 4.8GHz boost, and a 320W to 500W range.

    The 96-core tier is where the socket best shows its range. The 9656 is the standard part, at 400W with 512MB of L3 and a 3.7GHz boost for $9,713. The 9686F is the high-frequency host part AMD showcased in July, hitting 5GHz at 500W with a 400W to 600W range for $11,434. The 9G76 lands between them on price, with a 4.8GHz boost, a 320W floor to the F part’s 400W, and the same 384MB of cache. At 64 cores, the 9556 is the least expensive SP7 SKU at $8,008 and 300W, and the 9586F pairs the same core count and 384MB of L3 with a 3.75GHz base and 5GHz boost for $9,701.

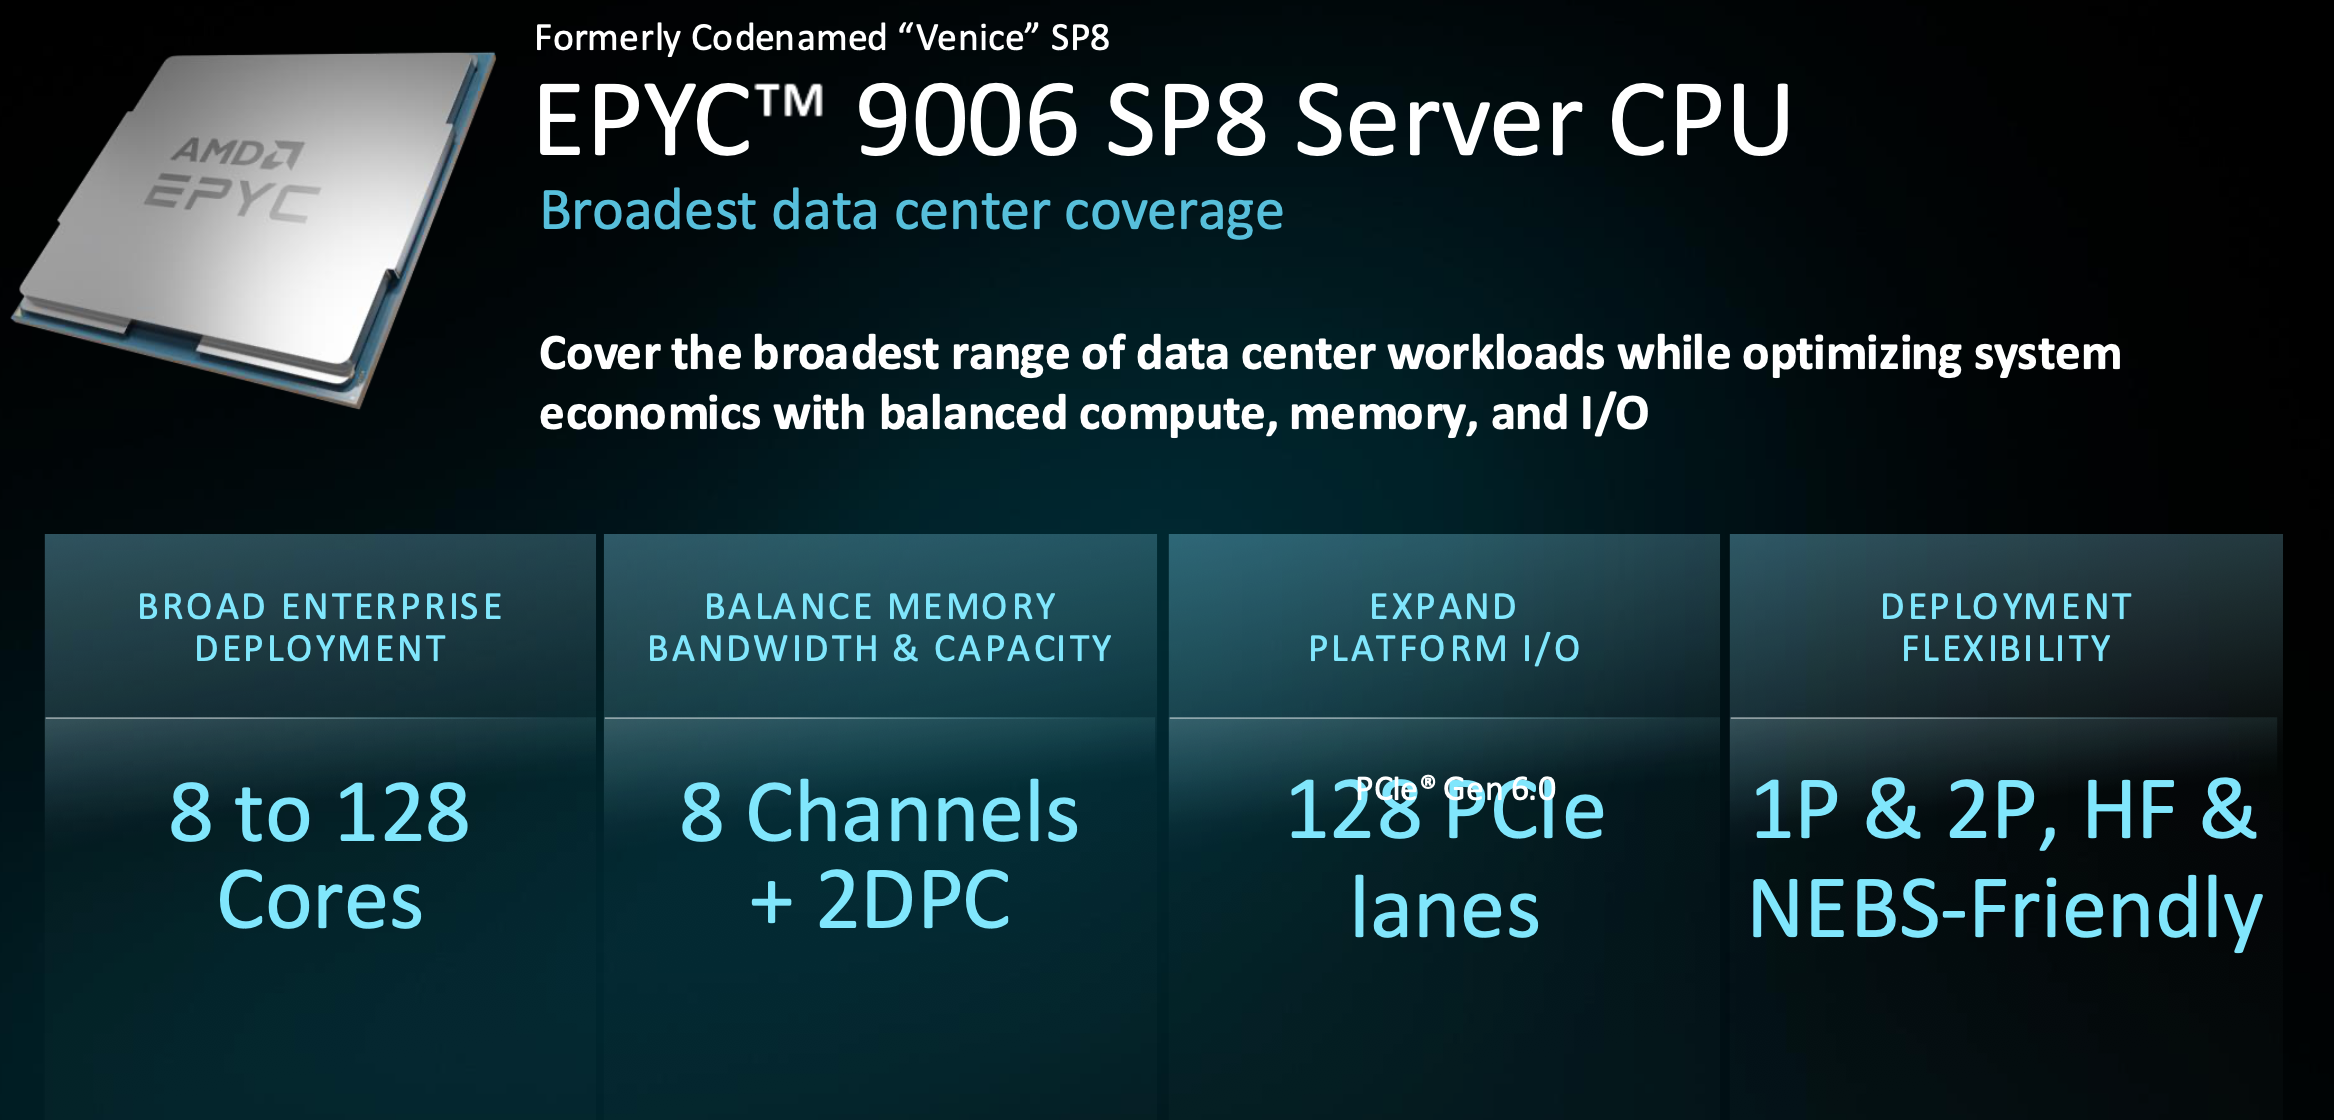
    AMD EPYC 9006 SP8 launch slide listing 8 to 128 cores, 8 memory channels with two DIMMs per channel, 128 PCIe Gen 6 lanes, and 1P and 2P, HF and NEBS-friendly options

    SP8: 22 Parts From 8 to 128 Cores

    SP8 is the socket most enterprise buyers will see, and its list is more than twice as long. Every part carries 8 memory channels at 512GB/s with RDIMMs or 819.2GB/s with MRDIMMs, PCIe 6.0 x128, and a power range that starts as low as 130W. Six F parts run to 5GHz, five P parts are single-socket only, and the remaining 11 are standard 1P or 2P processors.

    Model Cores / Threads Base Clock Max Boost L3 Cache Default CPU Power (Range) Sockets 1Ku Price
    EPYC 9746 128 / 256 2.9 GHz 4 GHz 512MB 400W (200W-400W) 1P / 2P $11,679
    EPYC 9736 128 / 256 2.7 GHz 3.7 GHz 256MB 360W (200W-400W) 1P / 2P $10,639
    EPYC 9736P 128 / 256 2.7 GHz 3.7 GHz 256MB 360W (200W-400W) 1P $9,989
    EPYC 9676F 96 / 192 3.1 GHz 5 GHz 384MB 400W (200W-400W) 1P / 2P $10,116
    EPYC 9646 96 / 192 2.8 GHz 3.7 GHz 256MB 300W (155W-300W) 1P / 2P $8,904
    EPYC 9646P 96 / 192 2.8 GHz 3.7 GHz 256MB 300W (155W-300W) 1P $8,001
    EPYC 9576F 64 / 128 3.55 GHz 5 GHz 384MB 400W (200W-400W) 1P / 2P $9,431
    EPYC 9536 64 / 128 3.25 GHz 4 GHz 256MB 300W (155W-300W) 1P / 2P $7,837
    EPYC 9526 64 / 128 2.75 GHz 3.7 GHz 256MB 220W (130W-220W) 1P / 2P $7,123
    EPYC 9536P 64 / 128 3.25 GHz 4 GHz 256MB 300W (155W-300W) 1P $6,595
    EPYC 9476F 48 / 96 3.65 GHz 5 GHz 192MB 330W (200W-400W) 1P / 2P $6,695
    EPYC 9456 48 / 96 3.2 GHz 3.7 GHz 256MB 265W (155W-300W) 1P / 2P $5,252
    EPYC 9456P 48 / 96 3.2 GHz 3.7 GHz 256MB 265W (155W-300W) 1P $4,628
    EPYC 9376F 32 / 64 3.8 GHz 5 GHz 192MB 285W (200W-400W) 1P / 2P $4,849
    EPYC 9356 32 / 64 3.6 GHz 4.5 GHz 192MB 250W (155W-300W) 1P / 2P $3,789
    EPYC 9336 32 / 64 3.15 GHz 3.7 GHz 128MB 195W (130W-220W) 1P / 2P $3,320
    EPYC 9356P 32 / 64 3.6 GHz 4.5 GHz 192MB 250W (155W-300W) 1P $2,795
    EPYC 9276F 24 / 48 3.8 GHz 5 GHz 96MB 230W (200W-400W) 1P / 2P $3,512
    EPYC 9256 24 / 48 2.85 GHz 4.5 GHz 96MB 190W (130W-220W) 1P / 2P $2,501
    EPYC 9176F 16 / 32 3.9 GHz 5 GHz 192MB 200W (200W-400W) 1P / 2P $3,787
    EPYC 9116 16 / 32 2.85 GHz 4.5 GHz 48MB 160W (130W-220W) 1P / 2P $1,200
    EPYC 9016 8 / 16 3.05 GHz 4.8 GHz 48MB 130W (130W-220W) 1P / 2P $700

    The top of the SP8 stack overlaps the bottom of SP7 on core count but undercuts it on price. The 128-core 9746 is $11,679 with 512MB of L3 at 400W, against $12,498 for the 128-core SP7 9756, and the 96-core 9646 is $8,904 at 300W against $9,713 for the SP7 9656; the difference buys the bigger socket’s double memory bandwidth. The 128-core 9736 drops to 256MB of L3 and a 3.7GHz boost for $10,639, and its single-socket twin, the 9736P, is $9,989.

    The P discount widens as the parts get smaller. At 128 cores the single-socket version saves 6%, at 96 cores 10%, at 64 cores 16%, at 48 cores 12%, and at 32 cores the 9356P is $2,795 against $3,789 for the 9356, a 26% cut for giving up the second socket. The F parts pay the opposite premium: the 64-core 9576F is $9,431, $1,594 over the standard 9536, for a 5GHz boost, 384MB of L3, and a 400W rating. The most curious part of the list is the 16-core 9176F, which carries 192MB of L3, 12MB per core, at $3,787, the profile of a CPU built for per-core software licensing, where cache per thread matters more than thread count. At the bottom, the 8-core 9016 is $700 at 130W, and the 16-core 9116 is $1,200.

    What Changed Since July

    Two details in the published pages update what AMD said in July. AMD’s launch deck listed PCIe Gen 6 as “up to 128 lanes (1P)” for the family; the SP8 slide claimed the full 128, and the SP7 slide gave no lane count at all. The processor pages now put numbers on both sockets: every SP7 part is listed at PCIe 6.0 x96, and all SP8 CPUs at x128.

    The second detail is the 400W EPYC 9956, the 256-core CPU AMD used in its rack-density endnotes in July, which has no product page yet; either it arrives later, or the density case now rests on the 600W 9996. AMD’s footnote says the list is subject to change, so that one may resolve before SP7 systems ship. Our earlier coverage of the first Venice platforms from Giga Computing, ASUS, and Supermicro has the system side; Giga Computing expects SP7 systems to ship with AMD’s November launch and SP8 systems to follow in March 2027. We’ve also seen plenty of pre-production units from others; Dell, for instance, showed early designs at the AMD event and later at DTW.

    AMD EPYC 9006 Series Product Page

    The post AMD Posts the Full EPYC 9006 SKU List: 31 Venice Parts From $700 to $14,904 Across SP7 and SP8 appeared first on StorageReview.com.


    NetApp to Acquire PEAK:AIO, Bringing Its Scale-Out pNFS Metadata Work to ONTAP Sep 25, 2026
    Show notes

    NetApp has agreed to acquire PEAK:AIO, the Manchester, UK software company whose metadata and parallel NFS work NetApp says will accelerate its AI infrastructure roadmap. NetApp plans to combine PEAK:AIO’s metadata services and parallel namespace technology with ONTAP, aiming at shared storage that scales alongside growing GPU clusters, in an architecture it says is intended to support trillions of files and multi-exabyte deployments. Terms weren’t disclosed, and the deal is subject to customary closing conditions and regulatory approvals.

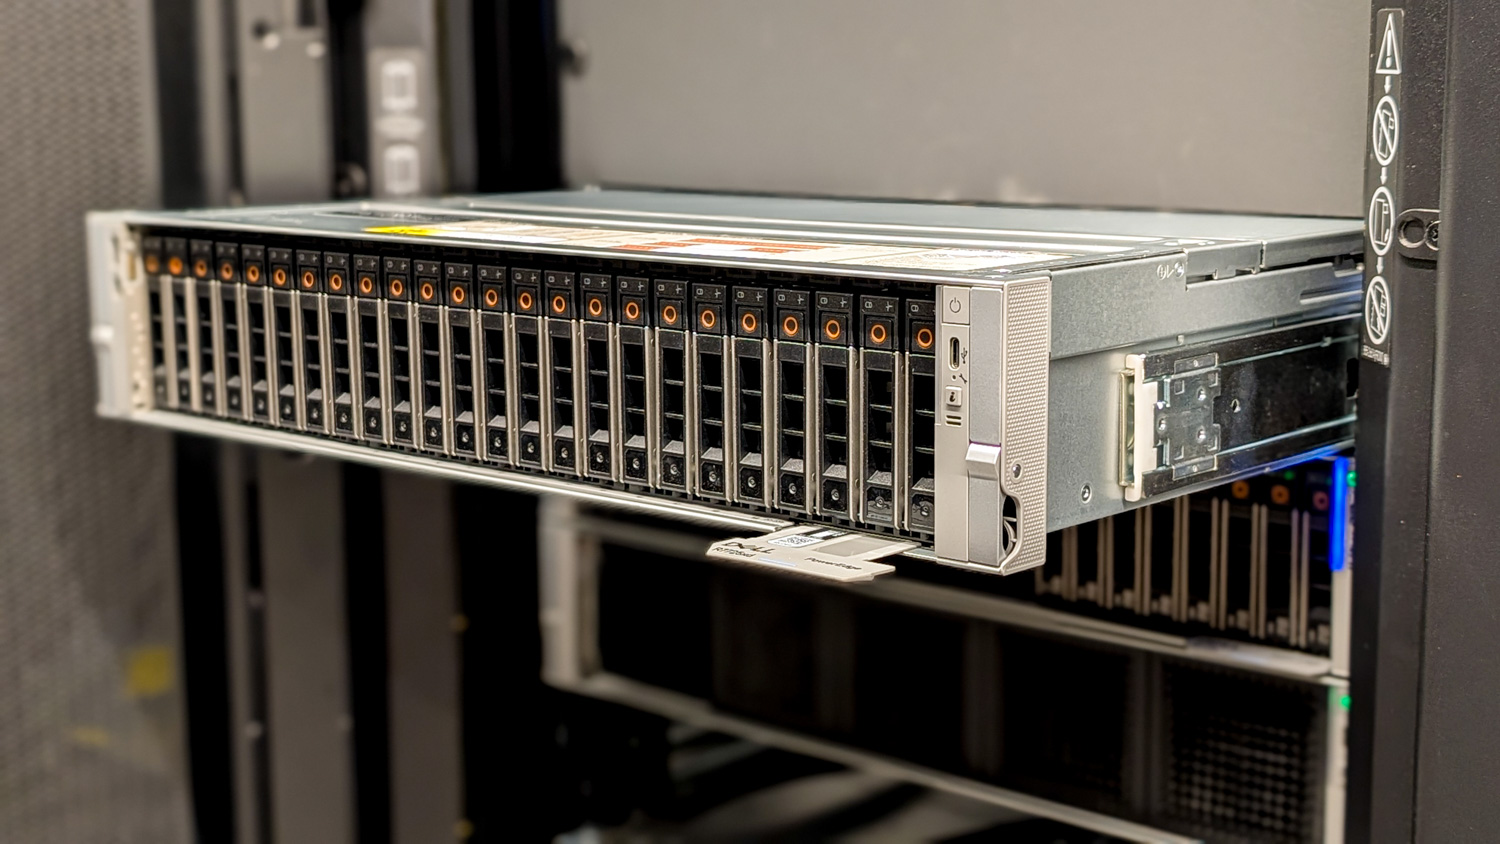
    Dell PowerEdge R7725xd with 24 front NVMe bays in a StorageReview lab rack, the server we tested with PEAK:AIO software at 160 GB/s over NVMe-oF RDMA

    “AI clouds need high-performance shared storage that can scale alongside growing GPU clusters while maintaining the resilience, security, and operational simplicity organizations depend on,” said George Kurian, CEO of NetApp. “With PEAK:AIO, we are delivering on our vision for a new generation of AI infrastructure that combines scalable metadata services with the proven foundation of ONTAP to help customers maximize infrastructure efficiency and support AI at hyperscale cloud.”

    Metadata That Scales on Its Own

    NetApp describes an architecture that disaggregates metadata from data so metadata services can scale independently of capacity. PEAK:AIO brings metadata scale, a global namespace, and parallel NFS access for massively parallel workloads, and NetApp brings ONTAP as the data foundation, with the resilience, security, and operational maturity its customers already run. NetApp says the combination is meant to reduce data-related GPU stalls and give existing ONTAP customers a clear evolution path.

    The most important piece of PEAK:AIO’s metadata work is pNFS Lattice, an open-source, scale-out metadata server for NFSv4.2 and pNFS Flex Files that PEAK:AIO initiated with Los Alamos National Laboratory and Carnegie Mellon University and published with support from the Linux Foundation. Lattice splits metadata authority, protocol coordination, and data placement into separate layers: multiple user-space metadata server daemons share a RonDB metadata store, clients reach the right metadata server through standard NFSv4 referrals, and the data servers are unpatched Linux knfsd instances serving flex-file layouts over TCP or RDMA. The code is on GitHub under an MIT license, with one GPL-2.0 file where it links to RonDB. PEAK:AIO labels it an early release for research, development, and testing, not yet recommended for production. LANL and PEAK:AIO are scheduled to present Lattice at the SNIA Developer Conference in Santa Clara September 28 to 30, including a Birds of a Feather session led by LANL’s Gary Grider.

    “NetApp and PEAK:AIO connected through the shared belief that the AI era demands a fundamentally new approach to data infrastructure,” said Mark Klarzynski, CTO and founder of PEAK:AIO. “What excites us most about joining NetApp is the opportunity to pair our culture of innovation with the reach, scale, and customer trust of a global leader.”

    What We’ve Seen PEAK:AIO Do

    We’ve followed PEAK:AIO closely for years, and the common thread is software that gets a lot out of standard servers. In 2023, PEAK:AIO’s AI Data Server pushed 80GB/s from a single storage node. In 2024, we visited London Zoo, where the Zoological Society of London runs two NVIDIA DGX systems against 1.2PB of PEAK:AIO storage for wildlife monitoring, and we covered its work with MONAI and Solidigm to keep medical AI on premises inside hospitals. In 2025, we tested a 2U AI Data Server with 1.5PB and 120GB/s on Dell hardware and Solidigm 61TB SSDs, followed by a CXL-based Token Memory Platform for KV cache reuse.

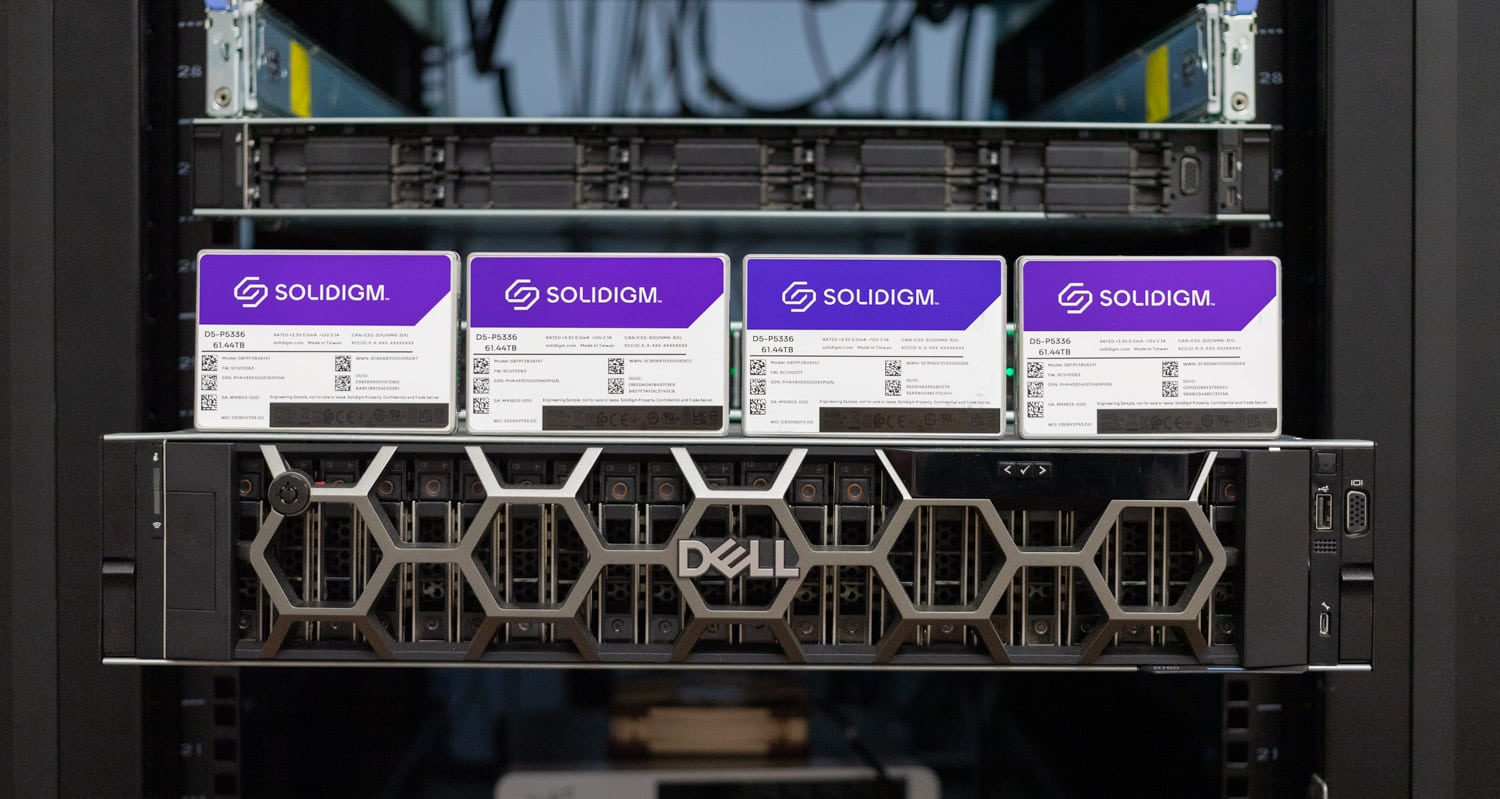
    Four Solidigm D5-P5336 61.44TB SSDs on top of a Dell PowerEdge server in the StorageReview lab, photographed for our PEAK:AIO, MONAI, and Solidigm medical AI coverage

    In our Dell PowerEdge R7725xd review, the server sustained over 300 GB/s across its 24 Gen5 NVMe drives locally, and PEAK:AIO served 160 GB/s over NVMe-oF RDMA to two clients on four 200Gb links, with random read bandwidth tracking sequential from 32K blocks up. We also used PEAK:AIO to build the NVMe-oF target for our NVIDIA DGX Spark review. When Brian sat down with Klarzynski at SC25 for Podcast #144, he talked about PEAK:AIO staying independent instead of becoming a feature inside a large vendor’s product line, and about a model where customers start with storage on a GPU server and add nodes to a growing namespace as their AI projects prove out. NetApp’s release centers on that same metadata and namespace work.

    PEAK:AIO CEO Roger Cummings put the company’s approach plainly in his LinkedIn post announcing the deal: “We didn’t start with technology and go looking for a problem to solve. We started with the problems customers were experiencing and built around them.”

    Where NetApp Takes It

    NetApp launched the AFX AI portfolio last October, pairing a disaggregated storage system that has a native parallel architecture with the AI Data Engine, and in July it bought DataPelago to run GPU data processing where the data already lives, which makes PEAK:AIO its second AI-focused acquisition in about two months. NetApp hasn’t said where PEAK:AIO’s technology will integrate first, but independently scaling metadata services, a global namespace, and parallel NFS access in front of ONTAP seem like a natural fit for AFX’s disaggregated design.

    As the deal closes, we’ll be watching whether NetApp keeps Lattice developing in the open; it’s a young, MIT-licensed project with LANL engineers presenting it at SDC this month. PEAK:AIO also built a following among hospitals, universities, and research labs that couldn’t justify a large array behind a single GPU server, and NetApp’s release is written around AI clouds at hyperscale, so it’ll be worth seeing how both ends of that spectrum play out. We like what PEAK:AIO has built, and NetApp’s sales reach and ONTAP installed base give that work a path into far more data centers than PEAK:AIO could on its own.

    PEAK:AIO

    The post NetApp to Acquire PEAK:AIO, Bringing Its Scale-Out pNFS Metadata Work to ONTAP appeared first on StorageReview.com.


    Supermicro NVIDIA Vera Rubin NVL72 Racks Now Shipping With 1.8MW In-Row CDUs and a 1,152-GPU Scalable Unit Sep 25, 2026
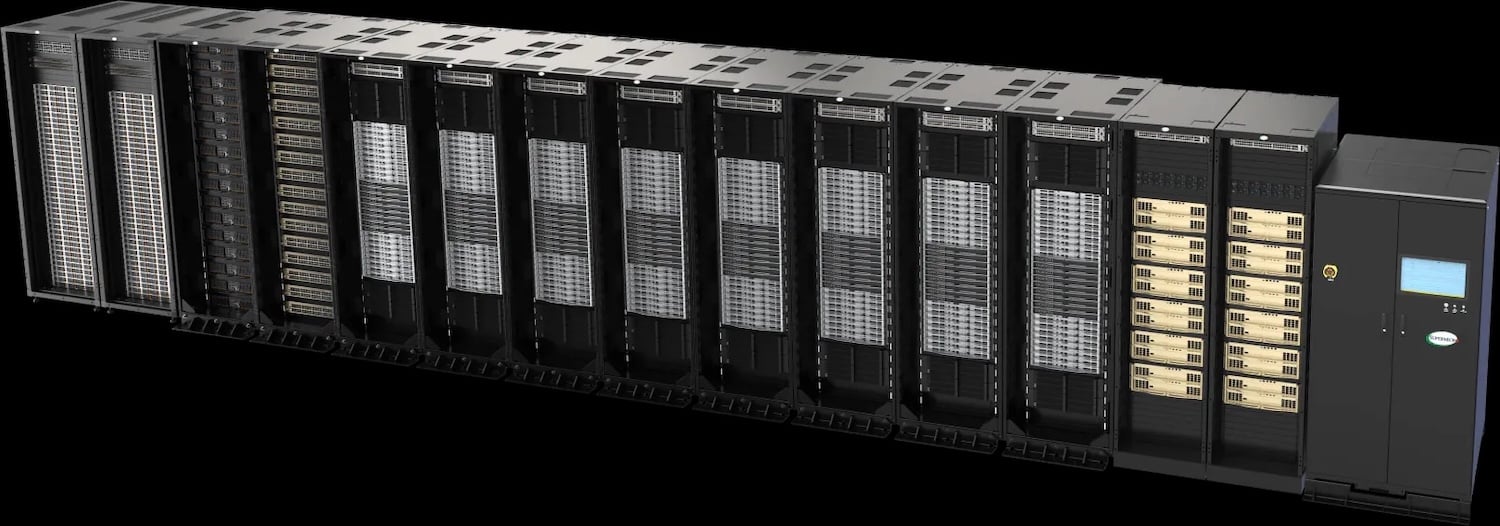
    Show notes Supermicro NVIDIA Vera Rubin NVL72 deployment render showing a row of liquid-cooled racks ending in a Supermicro in-row cooling distribution unit, vendor render Supermicro NVIDIA Vera Rubin NVL72 deployment render showing a row of liquid-cooled racks ending in a Supermicro in-row cooling distribution unit, vendor render

    Supermicro is now shipping NVIDIA Vera Rubin NVL72 racks integrated with its Data Center Building Block Solutions (DCBBS) and its DLC-2 direct liquid cooling stack. The racks follow the VR NVL72 design NVIDIA launched at CES 2026: 72 NVIDIA Rubin GPUs and 36 NVIDIA Vera CPUs in a single liquid-cooled rack that operates as one machine, spread across 18 1U compute trays with four Rubin GPUs and two Vera CPUs each. Nine sixth-generation NVIDIA NVLink switch trays connect the compute trays and deliver 216 TB/s of scale-up bandwidth, and each rack carries 20.7 TB of HBM4 and up to 54 TB of LPDDR5X.

    Supermicro NVIDIA Vera Rubin NVL72 deployment render showing a row of liquid-cooled racks ending in a Supermicro in-row cooling distribution unit, vendor render

    “We have spent years building the liquid-cooling stack, the manufacturing capacity, and the deployment teams for exactly this moment,” said Charles Liang, president and CEO of Supermicro. “Our customers can now order a Scalable Unit and receive production-ready systems with end-to-end integration, because we design and build every layer between the cold plate and the cooling tower.”

    DLC-2 From Cold Plate to Cooling Tower

    NVIDIA designed the Vera Rubin platform around direct liquid cooling, and Supermicro says the resulting heat load has to move through the full fluid distribution loop, from the cold plates through manifolds to the cooling tower. Supermicro builds that path from its own portfolio, which covers cold plates, manifolds, hose kits, rack power shelves, in-row CDUs, in-rack CDUs, Liquid-to-Air sidecar CDUs, rear door heat exchangers, and facility-side cooling towers. Supermicro first outlined its liquid cooling plans for Vera Rubin NVL72 in January.

    The shipping NVL72 package pairs the racks with Supermicro in-row cooling distribution units (CDUs) rated at 1.8MW each and deployed with N+1 redundancy, plus optional rear door heat exchangers to capture residual heat. Supermicro tests and validates every rack with the full liquid cooling stack, which it says speeds time-to-online once the racks are deployed.

    Scalable Unit Blueprint and Cluster Deployment

    Supermicro’s DCBBS Blueprint defines a balanced bill of materials for a given power envelope, from 5 MW to gigawatt scale, the same approach the company took with its Vera Rubin NVL4 DCBBS Blueprint in June. One Vera Rubin NVL72 Scalable Unit spans 16 compute racks with 1,152 Rubin GPUs and 331 TB of HBM4, sized alongside matching cooling capacity, power delivery, high-performance storage, context memory storage, and networking.

    Supermicro also handles networking integration and cabling to the NVIDIA Reference Architecture, covering the AI compute fabric, the converged fabric, and out-of-band management, and a Supermicro team runs each project from site survey and design through integration, testing, delivery, deployment, and ongoing support. Supermicro rack-scale compute is also part of Cisco’s Secure AI Factory, which added Vera Rubin NVL72 support in August.

    Supermicro NVIDIA Vera Rubin Product Page

    The post Supermicro NVIDIA Vera Rubin NVL72 Racks Now Shipping With 1.8MW In-Row CDUs and a 1,152-GPU Scalable Unit appeared first on StorageReview.com.


    WhiteFiber Continuum Goes Commercial, Scaling Its 83 km Two-Site GPU Supercluster Design to 136 Tbps Sep 25, 2026
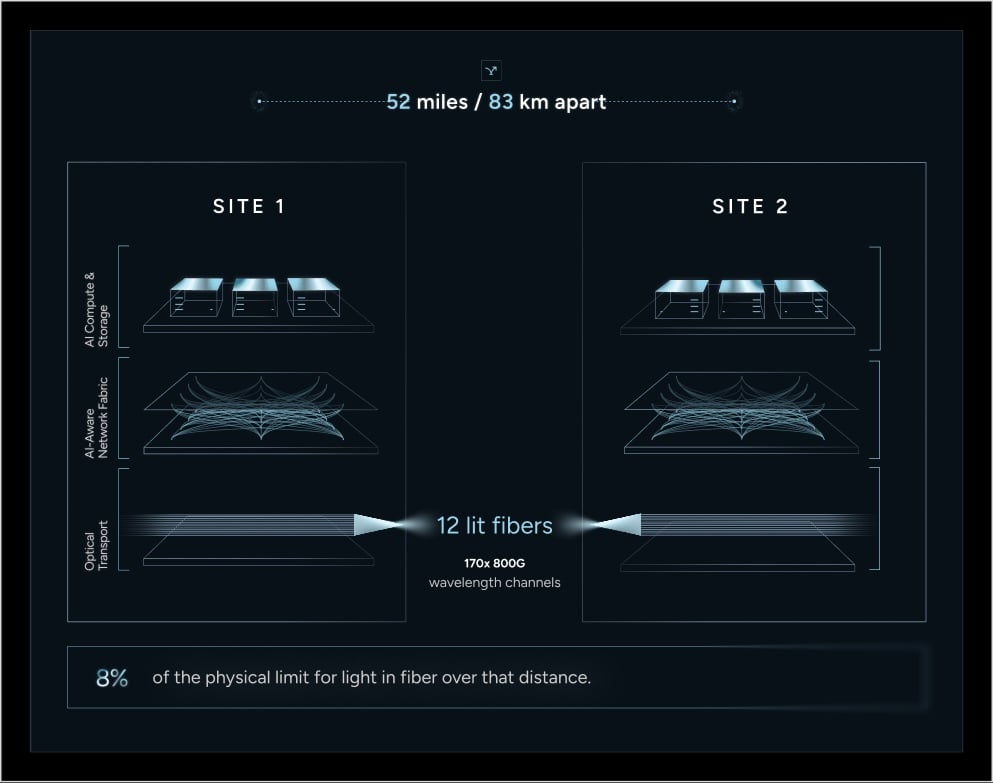
    Show notes WhiteFiber Continuum architecture diagram showing two sites 83 km apart, each with AI compute and storage, AI-aware network fabric, and optical transport layers, joined by 12 lit fibers carrying 170 x 800G wavelength channels, vendor diagram WhiteFiber Continuum architecture diagram showing two sites 83 km apart, each with AI compute and storage, AI-aware network fabric, and optical transport layers, joined by 12 lit fibers carrying 170 x 800G wavelength channels, vendor diagram

    WhiteFiber has made WhiteFiber Continuum commercially available, turning the two-site GPU supercluster it first detailed as Project Redwood in July into a product enterprises can deploy. WhiteFiber calls Continuum its highest-performance cross-data-center networking solution and the first commercially available distributed GPU supercluster architecture. It links geographically separated data centers into a single logical GPU supercluster, and WhiteFiber says that removes bandwidth and throughput as constraints on how and where AI infrastructure can be deployed.

    WhiteFiber Continuum architecture diagram showing two sites 83 km apart, each with AI compute and storage, AI-aware network fabric, and optical transport layers, joined by 12 lit fibers carrying 170 x 800G wavelength channels, vendor diagram

    Continuum runs across two HITRUST-certified QTS facilities 83 kilometers apart, joined over 12 Zayo dark fiber strands, with DriveNets AI Fabric carrying the network and WEKA NeuralMesh providing data storage and memory infrastructure across the cluster. WhiteFiber rates the architecture at 136 Tbps of aggregate bandwidth, which its product page breaks out as 170 800G wavelength channels, with 0.9 milliseconds of guaranteed round-trip latency that it says is within 8% of the physical limit for light in fiber over that distance. The July R&D result measured 111.2 Tbps on part of the fiber spectrum; WhiteFiber says the design reaches 136 Tbps after additional wavelengths come online, and full-fiber spectrum testing is underway to confirm the guaranteed commercial specifications. The company has submitted patent applications for the underlying implementation.

    “WhiteFiber Continuum is the infrastructure answer to a problem the industry has lived with for years: geographic distance as a ceiling on what a cluster can do,” said Sam Tabar, CEO of WhiteFiber. “Today we are making it commercially available to enterprises that need AI compute to perform at scale, hold up under compliance requirements, and not break when a single site has a problem.”

    DriveNets AI Fabric Across the 83 km Link

    DriveNets supplies the Ethernet-based AI Fabric connecting both sites, the same role it played in the July R&D work. “DriveNets’ Ethernet-based AI fabric delivers the highest performance even in the most demanding, high-bandwidth, low-latency environments, ensuring scale-across superclusters move data efficiently, maximize GPU utilization, and optimize power efficiency,” said Yossi Kikozashvili, VP Product and GTM for AI Infra at DriveNets. WhiteFiber’s product page says both sites carry live traffic at the same time and only model gradients cross the inter-site link, so a single job can run across the full cluster or split into independent workloads that burst across sites as demand shifts.

    WEKA NeuralMesh as the Shared Data Layer

    WEKA provides the storage and memory tier with NeuralMesh, which gives Continuum a single storage and memory foundation spanning both facilities. Liran Zvibel, co-founder and CEO at WEKA, said “a supercluster is only as unified as its data,” adding that “WEKA’s NeuralMesh gives Continuum a single, high-performance storage and memory foundation across sites, so GPUs that sit many kilometers apart operate as if the data were local.”

    Power Aggregation and Regulatory Data Boundary Control

    Continuum lets telecom and metro facilities with spare power and fiber capacity contribute to a single logical GPU supercluster, which WhiteFiber pitches as a way to turn stranded telco and metro assets into capacity for last-mile inference and agent workloads. Enterprises can use the same architecture to pool GPUs across sites and get past the power and space ceiling of a single campus, adding overflow training and inference capacity without standing up a separate greenfield deployment. For regulated industries, WhiteFiber says Continuum keeps sensitive workloads within their originating jurisdiction while failover and pooled compute happen across locations, and because neither site is a single point of failure, it’s designed so training runs continue when one location goes down.

    WhiteFiber says additional sites can join the same logical cluster over time using the same networking approach, and it’s hosting a technical walkthrough of the architecture with DriveNets and WEKA on October 14.

    WhiteFiber Continuum Product Page

    The post WhiteFiber Continuum Goes Commercial, Scaling Its 83 km Two-Site GPU Supercluster Design to 136 Tbps appeared first on StorageReview.com.


    TerraMaster 725 Series Brings Xeon D and 50Gbps of Networking to 8- to 16-Bay Rackmount NAS Sep 24, 2026
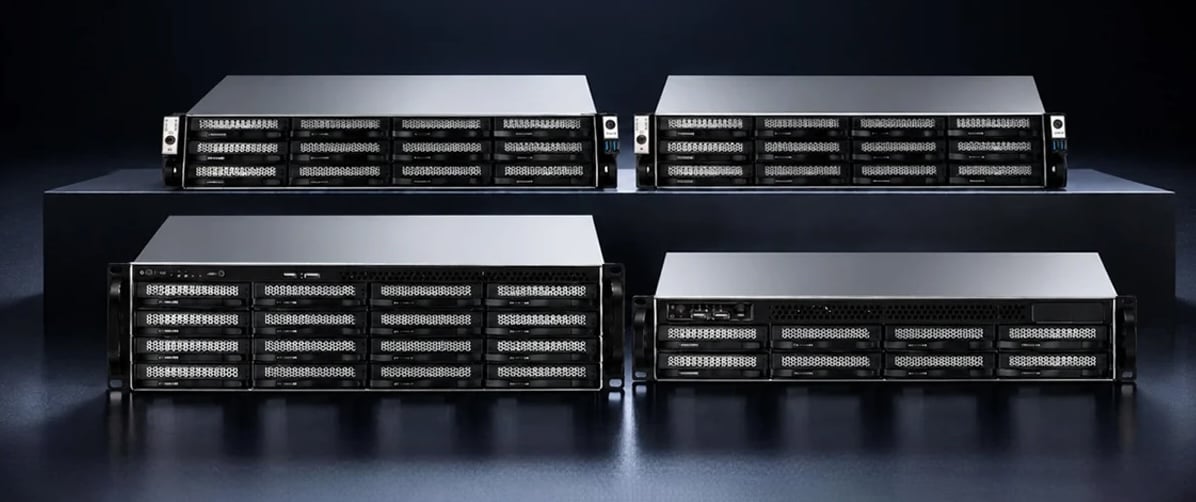
    Show notes TerraMaster 725 Series rackmount NAS lineup: two 12-bay 2U systems, a 16-bay 3U system, and an 8-bay 2U system, vendor render TerraMaster 725 Series rackmount NAS lineup: two 12-bay 2U systems, a 16-bay 3U system, and an 8-bay 2U system, vendor render

    TerraMaster has launched the 725 Series, four Intel Xeon D rackmount NAS systems aimed at enterprise file storage, backup, virtualization, media production, and AI dataset storage: the U8-725, U12-725, U12-725 Plus, and U16-725 Plus. Every model ships with 16GB of ECC memory, four 10GbE SFP+ and two 5GbE ports, and three M.2 slots for PCIe 4.0 NVMe SSDs. The standard models use the 4-core Xeon D-2712T, and the Plus models step up to the 8-core Xeon D-2733NT.

    TerraMaster 725 Series rackmount NAS lineup: two 12-bay 2U systems, a 16-bay 3U system, and an 8-bay 2U system, vendor render

    Xeon D, 50Gbps of Networking, and PCIe 4.0 Expansion

    The U12-725 pairs the Xeon D-2712T (4 cores, 8 threads, 1.9GHz base, 3.0GHz turbo) with 16GB of DDR4 ECC memory, expandable to 1TB across eight DIMM slots. Its four 10GbE SFP+ and two 5GbE RJ45 ports add up to 50Gbps of network bandwidth, and the chassis offers four PCIe expansion slots (two PCIe 4.0 x8, one PCIe 3.0 x8, and one PCIe 4.0 x4) alongside the three M.2 slots. The Plus models use the Xeon D-2733NT (8 cores, 16 threads, 2.1GHz base, 3.2GHz turbo) with the same memory and networking. The 8- and 12-bay models are 2U, and the U16-725 Plus is a 3U chassis with three PCIe slots. All four ship with an 800W power supply, with a redundant option available.

    Under TerraMaster’s laboratory test conditions, the company says the U12-725 reached up to 6,250MB/s sequential read, up to 3,480MB/s sequential write, and up to 945,063 IOPS in 4K random reads. TerraMaster notes that actual performance varies by hardware configuration, RAID mode, network environment, and workload, and its U8-725 product page cites the same 6,250MB/s read figure in network aggregation mode on RAID 6. That figure equals the 50Gbps combined line rate of all six network ports.

    Four Rackmount Models for Consolidated Storage

    The 725 Series targets enterprise file storage and collaboration, backup and disaster recovery, virtualization, 4K and 8K media production, AI training dataset storage, and video surveillance. TerraMaster positions the systems as unified storage platforms for organizations consolidating these workloads onto a single rackmount NAS.

    Model Drive Bays Processor Positioning
    U8-725 8-bay, 2U Xeon D-2712T (4-core) Enterprise file storage, backup, and virtualization
    U12-725 12-bay, 2U Xeon D-2712T (4-core) High-performance unified storage, media, AI data, and surveillance
    U12-725 Plus 12-bay, 2U Xeon D-2733NT (8-core) High-concurrency, AI, virtualization, and professional media
    U16-725 Plus 16-bay, 3U Xeon D-2733NT (8-core) Large-scale enterprise data and demanding workloads

    Maximum raw capacity runs from 240TB on the U8-725 to 360TB on the two 12-bay models and 480TB on the U16-725 Plus. TerraMaster says the lineup gives distributors, resellers, system integrators, IT service providers, and security integrators configuration options matched to customer data volumes, workload needs, and expansion plans.

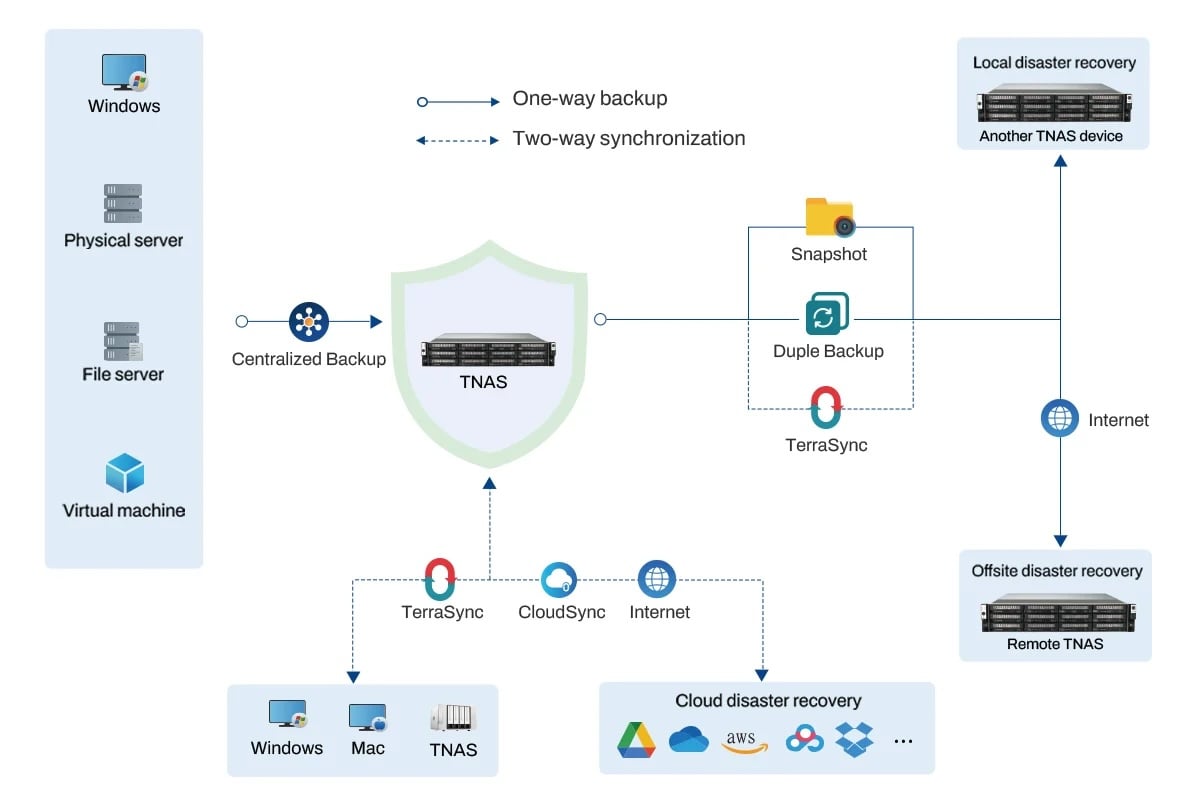
    TerraMaster 725 Series backup and disaster recovery topology: centralized backup from Windows PCs, servers, and VMs to a TNAS, with snapshots, Duple Backup, and TerraSync to local, remote, and cloud targets, vendor diagram

    TOS 7 Adds Data Search and Indexing Functions

    The systems run TOS 7, which TerraMaster describes as its AI-Native operating system, with enhanced capabilities for large-scale data search, indexing, and intelligent management. TOS 7 also runs across the BBS backup servers TerraMaster launched in August.

    For AI development teams, TerraMaster positions the 725 Series as centralized storage for training datasets and related data assets. The company also says the platform can provide local data storage for private AI knowledge bases, intelligent applications, and data analytics.

    The 725 Series launched on September 22. TerraMaster’s U.S. online store lists the U8-725 at $4,999, the U12-725 at $5,499, the U12-725 Plus at $7,199, and the U16-725 Plus at $8,299, each with 16GB of memory.

    TerraMaster U12-725 Product Page

    The post TerraMaster 725 Series Brings Xeon D and 50Gbps of Networking to 8- to 16-Bay Rackmount NAS appeared first on StorageReview.com.


    Solidigm D5-P5430 30.72TB E3.S Review: Gen4 QLC for Mixed Workloads Sep 24, 2026
    Show notes

    The Solidigm D5-P5430 is the mainstream tier of Solidigm’s QLC data center line. It’s the drive that sits below the capacity-maximizing D5-P5336 and carries a smaller indirection unit for the mixed and small-block write workloads a 16KB-IU drive handles poorly. We reviewed the 15.36TB P5430 at launch in 2023, when the story was the jump from the P5316’s 64KB indirection unit to 4KB and what that did for small-block writes. The 30.72TB E3.S model in the lab now tops the family with an 8KB indirection unit, and it arrives into a very different comparison set: the high-capacity QLC class has moved to 61TB, 122TB, and 245TB drives, several of them on Gen5, while the P5430 is a PCIe 4.0 x4 drive, tested here in the 7.5mm E3.S form factor the family offers alongside U.2 and E1.S. Solidigm rates the family at up to 7,000MB/s sequential read and 3,000MB/s sequential write, up to 971K random read IOPS and 120K random write IOPS, with the 30.72TB model specifically listed at 934.5K random read IOPS and 31.92PBW of endurance, which works out to 0.58 DWPD over the five-year warranty on a 100 percent random write workload. Power is rated at up to 25W active and 5W idle. Solidigm’s pitch for the P5430 has always been density with a TLC-like read profile at QLC cost. The drive carries the enterprise checklist: 192-layer 3D QLC NAND behind Solidigm’s own controller and firmware, PCIe 4.0 x4 with NVMe 1.4c, end-to-end data protection with ECC and CRC active together, power loss protection, secure boot, TCG Opal 2.0 and FIPS 140-2 Level 2 options, OCP 2.0 telemetry, and platform validation on Intel, AMD, Ampere, and NVIDIA. The family spans 3.84TB to 30.72TB in U.2 15mm and E3.S 7.5mm, with E1.S 9.5mm topping out at 15.36TB. Solidigm D5-P5430 30.72TB Specifications Specification Solidigm D5-P5430 30.72TB Platform Overview Capacity (tested) 30.72TB Family Capacities U.2 and E3.S: 3.84TB, 7.68TB, 15.36TB, 30.72TBE1.S: 3.84TB, 7.68TB, 15.36TB Form Factor U.2 15mmE3.S 7.5mm (tested)E1.S 9.5mm Interface PCIe 4.0 x4, NVMe 1.4c NAND 192-layer 3D QLC Indirection Unit 8KB (30.72TB)4KB (3.84TB to 15.36TB) Performance (vendor rated) Sequential Read Up to 7,000MB/s Sequential Write Up to 3,000MB/s Random 4K Read Up to 971K IOPS (family)934.5K IOPS (30.72TB) Random 4K Write Up to 120K IOPS Power and Endurance Endurance 31.92PBW (30.72TB)Up to 0.58 DWPD, 100% random write Power Up to 25W activeUp to 5W idle Warranty 5 years Features Data Protection End-to-end data protection (ECC and CRC)Power loss protectionUBER tested to 1E-17 Security Secure bootTCG Opal 2.0FIPS 140-2 Level 2 (select SKUs) Management OCP 2.0 log pages and telemetry Platform Validation Intel, AMD, Ampere, NVIDIA Solidigm D5-P5430 30.72TB Performance Drive Testing Platform We use a Dell PowerEdge R760 running Ubuntu 22.04.2 LTS as our test platform for all workloads in this review. Equipped with a Serial Cables Gen5 JBOF, it offers wide compatibility with U.2, E1.S, E3.S, and M.2 SSDs. Our system configuration is outlined below: 2 x Intel Xeon Gold 6430 (32-Core, 2.1GHz) 16 x 64GB DDR5-4400 480GB Dell BOSS SSD Serial Cables Gen5 JBOF Drives Compared Solidigm D5-P5430 30.72TB (Gen4 | E3.S 7.5mm) Solidigm D5-P5336 61.44TB (Gen4 | U.2) Solidigm D5-P5336 122.88TB (Gen4 | U.2) DapuStor J5060 61.44TB (Gen4 | U.2) DapuStor R6060 122.88TB (Gen5 | E3.L) Micron 6550 ION 61.44TB (Gen5 | E3.S, TLC) Micron 6600 ION 245.76TB (Gen5 | E3.L) The comparison group is the high-capacity QLC class as it stands today, with one TLC drive included for scale. The P5430 is the smallest drive in the set and the only one below 61TB, and it shares a Gen4 link with the P5336 61.44TB and P5336 122.88TB and the DapuStor J5060, all three in U.2. The DapuStor R6060, Micron 6600 ION, and Micron 6550 ION bring Gen5 links, so where the P5430 keeps pace with them, it’s doing so with half the bus. Only the TLC 6550 ION shares the P5430’s E3.S form factor; the point of the group is to show where a 30TB Gen4 QLC drive lands when the alternatives on the shelf are bigger, newer, or both. FIO Performance Benchmark To measure the storage performance of each SSD across common industry metrics, we use FIO. Each drive undergoes the same testing process, which includes a preconditioning step of two full drive fills with a sequential write workload, followed by steady-state performance measurement. As each workload type being measured changes, we run another preconditioning fill of that new transfer size. In this section, we focus on the following FIO benchmarks: 128K Sequential 64K Random 4K Random 128K Sequential Write (IODepth 16 / NumJobs 1) The P5430 delivered 3,150.2MB/s in the 128K sequential write test, exceeding its 3,000MB/s rating and matching the Solidigm P5336 122.88TB at 3,152.5MB/s for the Gen4 QLC lead. The DapuStor R6060 122.88TB reached 3,920.6MB/s on its Gen5 link, and the TLC Micron 6550 ION 61.44TB sat far above the rest at 10,456.4MB/s. Below the P5430 were the DapuStor J5060 61.44TB at 2,883.1MB/s, the Micron 6600 ION 245.76TB at 2,838.0MB/s, and the Solidigm P5336 61.44TB at 2,503.5MB/s, putting the 30.72TB P5430 312.2MB/s ahead of the 245.76TB 6600 ION. 128K Sequential Write Latency (IODepth 16 / NumJobs 1) Latency followed bandwidth, with the P5430 at 634.5µs, a whisker from the P5336 122.88TB at 634.0µs and behind only the 6550 ION at 191.0µs and the R6060 at 509.7µs. The J5060 at 693.3µs, the 6600 ION at 704.3µs, and the P5336 61.44TB at 798.4µs trailed. 128K Sequential Read (IODepth 64 / NumJobs 1) The P5430 posted 7,132.1MB/s in 128K sequential read, effectively identical to the P5336 61.44TB at 7,132.3MB/s, the J5060 at 7,126.8MB/s, and the P5336 122.88TB at 7,121.6MB/s, and a touch above the drive’s 7,000MB/s rating. All four Gen4 drives are pinned at the same ceiling, and the Gen5 drives run away from it: the 6550 ION at 13,979.7MB/s, the 6600 ION at 12,729.8MB/s, and the R6060 at 11,554.0MB/s. 128K Sequential Read Latency (IODepth 64 / NumJobs 1) The P5430 recorded 1,121.3µs in 128K sequential read latency, tied with the P5336 61.44TB at 1,121.3µs and within 2µs of the J5060 and P5336 122.88TB. The Gen5 drives finished between 571.9µs (6550 ION) and 692.1µs (R6060). 64K Random Write The P5430 opened the 64K random write sweep at 2,359.9MB/s and 37.8K IOPS at 1/1, reached 3,149.9MB/s at 2/1, and then held between 3,090.7MB/s and 3,156.5MB/s across the remaining 16 points of the sweep, peaking at 3,156.5MB/s and 50.5K IOPS at 32/4 and closing at 3,149.6MB/s at 32/8. That’s the same 3.15GB/s write ceiling the 128K test found, and from 2/1 on, the P5430 sat at that level at every queue depth and job count. In the group, the P5336 122.88TB ran a near-identical plateau, from 2,429.9MB/s to 3,182.7MB/s, and the R6060 held between 3,913.8MB/s and 3,916.9MB/s after starting at 3,477.9MB/s. The J5060 stayed close to 2,883MB/s with two dips into the 2,700MB/s range, and the P5336 61.44TB ran between 2,412.9MB/s and 2,721.4MB/s. The 6600 ION swung between 569.1MB/s and 2,999.6MB/s depending on the combination, and finished at 694.8MB/s and 11.1K IOPS at 32/8, while the TLC 6550 ION sat in another class, reaching up to 10,413.1MB/s. 64K Random Write Latency Because throughput was flat, the P5430’s latency scaled almost exactly with outstanding I/O: 26.1µs at 1/1, 39.3µs at 2/1, 79.0µs to 80.5µs at four outstanding, 158.3µs to 161.4µs at eight, 317.1µs to 322.9µs at 16, 633.7µs to 645.2µs at 32, 1,268.6µs at 64, 2,533.9µs to 2,539.5µs at 128, and 5,079.3µs at 32/8. The P5336 122.88TB ended at 5,121.2µs, the J5060 at 5,548.9µs, and the P5336 61.44TB at 6,026.4µs, while the R6060 closed at 4,086.6µs and the 6550 ION at 1,588.0µs. The 6600 ION’s write swings showed up in latency too, at 23,020.7µs at 32/8. 64K Random Read The P5430 climbed from 273.3MB/s and 4.4K IOPS at 1/1 through 1,038.8MB/s at 1/4, 1,951.8MB/s at 1/8, 3,447.6MB/s at 2/8, and 5,591.4MB/s at 4/8, then hit the Gen4 wall at 7,124.8MB/s and 114.0K IOPS at 8/8 and stayed there, within 1MB/s, for the last five points of the sweep. The three other Gen4 drives, the J5060 and both P5336s, topped out at the same 7,125MB/s, and the Gen5 drives cleared it by a wide margin: the R6060 at 13,274.8MB/s, the 6550 ION at 13,204.6MB/s, and the 6600 ION at 11,946.5MB/s. 64K Random Read Latency Read latency for the P5430 started at 228.2µs at 1/1 and stayed between 240µs and 296µs through the eight-outstanding points, then rose to 290µs to 321µs at 16 outstanding, 357µs to 374µs at 32 outstanding, 560.9µs at 64 outstanding, 1,122µs at 128 outstanding, and 2,244.9µs at 32/8 once the drive was bandwidth-bound. The J5060 and both P5336 drives ended within 1µs of the same 2,245µs figure, since all four are saturating the same link; the Gen5 drives finished between 1,204.5µs for the R6060 and 1,467.8µs for the 6600 ION. At the light end, the P5430’s 228.2µs was among the slowest first-access figures in the group, alongside the P5336 122.88TB at 227.5µs, with the 6600 ION quickest at 110.3µs. 4K Random Read The P5430 scaled from 10.0K IOPS at 1/1 to 77.1K at 1/8, 147.0K at 2/8, 273.3K at 4/8, 495.5K at 8/8, and 822.6K at 16/8, then peaked at 975.2K IOPS and 3,809.2MB/s at 32/8. That peak is above Solidigm’s 934.5K rating for the 30.72TB model, and it beat both P5336 drives, at 948.9K for the 61.44TB and 935.8K for the 122.88TB. The single-job points scaled far more slowly, reaching only 130.2K at 32/1, so the drive needs parallel jobs to reach its rating. The Gen5 drives and the J5060 went well past it at 32/8: the 6550 ION at 1.797M, the 6600 ION at 1.727M, the R6060 at 1.656M, and the J5060 at 1.322M. 4K Random Read Latency The P5430’s 4K read latency was 99.8µs at 1/1 and stayed between 102µs and 130µs on the multi-job points through 8/8, while the single-job deep-queue points at 8/1, 16/1, and 32/1 ranged from 166µs to 245µs. It rose to 142.4µs at 16/4, 155.0µs at 16/8, 172.6µs at 32/4, and 261.8µs at 32/8 as the drive approached its IOPS ceiling. The two P5336 drives followed the same curve within a few microseconds and ended at 268.8µs and 272.0µs at 32/8. The 6600 ION had the lowest first-access figure at 52.4µs and the 6550 ION the lowest at the top end at 141.5µs. 4K Random Write The P5430 opened the 4K random write sweep at 81.8K IOPS at 1/1 with 11.8µs of latency, climbed to 134.1K at 1/4, and peaked at 152.5K IOPS and 595.8MB/s at 1/8. After that peak, it held between 111.7K and 149.7K on every remaining combination up to 64 outstanding I/Os, except for a dip to 84.6K on the single-job 32/1 point, and settled at 88.2K at 16/8, 90.3K at 32/4, and 74.2K at 32/8 once 128 or more writes were outstanding. Solidigm rates the drive at 120K, and the P5430 cleared that on nine of the 18 points, all of them between four and 32 outstanding I/Os. It stayed within 7 percent of the rating at 64 outstanding and fell 25 to 38 percent below it at the two deepest queue levels. The closest QLC drive, the 6600 ION, peaked at 113.8K but oscillated between 41K and 114K across the sweep and finished at 41.4K; the R6060 peaked at 51.2K and finished at 30.8K; the P5336 122.88TB peaked at 45.5K and finished at 25.9K. The TLC 6550 ION was the only drive in the same range, at a 116.2K peak and 95.5K at 32/8. The J5060 and the P5336 61.44TB didn’t complete the 4K random write test when this group was originally run, so they’re absent from this chart. 4K Random Write Latency Latency stayed at 11.8µs at 1/1, 19.2µs at 2/1, 29.3µs at 1/4, 51.8µs at 1/8, and 106µs to 126µs at 16 outstanding, then rose with queue depth to 255µs to 378µs at 32, 558µs to 572µs at 64, 1,416µs to 1,450µs at 128, and 3,449.4µs at 32/8. That final figure compares with 2,676.6µs for the 6550 ION, 6,141.0µs for the 6600 ION, 8,295.3µs for the R6060, and 9,859.8µs for the P5336 122.88TB. GPU Direct Storage One of the tests we conducted on this testbench was the Magnum IO GPU Direct Storage (GDS) test. GDS is a feature developed by NVIDIA that allows GPUs to bypass the CPU when accessing data stored on NVMe drives or other high-speed storage devices. GDS moves data directly between the storage device and GPU memory without staging it in system memory, reducing latency and increasing throughput. Traditionally, when a GPU processes data stored on an NVMe drive, the data must first travel through the CPU and system memory before reaching the GPU. This process introduces bottlenecks, as the CPU acts as an intermediary, adding latency and consuming CPU cycles and memory bandwidth. GPU Direct Storage removes that hop by letting the GPU access data directly from the storage device via the PCIe bus, and for AI workloads that stream terabytes through a training or inference pipeline, that direct path is what keeps GPUs from sitting idle on I/O. Our GDSIO sweep runs sequential reads and writes at transfer sizes of 16K, 128K, and 1M across 1 to 128 threads, and we report throughput, IOPS, and average latency for each point. GDSIO Sequential Read Throughput The P5430’s read curve has the shape we’ve come to expect from Solidigm’s QLC controllers: uneven at 16K, then a clean climb once the transfer size grows. At 16K, it opened at 537MiB/s on a single thread, dropped to 166MiB/s at four threads and 179MiB/s at eight, then recovered to 345MiB/s at 16, 501MiB/s at 32, and 808MiB/s at 64, finishing at 1.1GiB/s on 128 threads. That single-thread dip and recovery is the same pattern the P5336 drives and both DapuStors showed in the small-block section, and it left the P5430 in the middle of the group at 16K, well behind the Micron 6600 ION’s 1.9GiB/s at the top end but ahead of the two DapuStors and level with the 6550 ION through the mid-thread range. At 128K, the P5430 moved from 290MiB/s with one thread to 713MiB/s with four, 1.1GiB/s with eight, 1.6GiB/s with 16, 2.0GiB/s with 32, 2.1GiB/s with 64, and 2.3GiB/s with 128. That tracked the P5336 122.88TB almost point-for-point and finished on par with the 6550 ION, but the Gen5 drives pulled away here: the 6600 ION reached 5.3GiB/s, the R6060 4.9GiB/s, and the J5060 3.8GiB/s at 128 threads, with the P5336 61.44TB at 2.8GiB/s. The 1M results are where the P5430’s Gen4 link shows its ceiling. It started at 1.0GiB/s on one thread, jumped to 2.9GiB/s at four and 3.3GiB/s at eight, then flattened at 3.6GiB/s from 16 threads, 3.7GiB/s at 64, and 3.8GiB/s at 128. The plateau from 16 threads onward is the drive running out of bus, and it puts the P5430 in a tight cluster with the three other Gen4 drives: the P5336 122.88TB at 4.1GiB/s and the P5336 61.44TB and J5060 at 4.3GiB/s. The Gen5 pair at the top separated cleanly, with the R6060 and the 6600 ION both at 5.9GiB/s, while the TLC 6550 ION trailed the group at 2.6GiB/s in this test. On a large-block GPU read stream, the P5430 delivers roughly 90 percent of what the larger Gen4 QLC drives do and about two-thirds of the Gen5 leaders. GDSIO Sequential Read IOPS The P5430 peaked at 74.8K IOPS on the 16K workload at 128 threads, which placed it fourth in the group behind the 6600 ION at 130.4K, the P5336 61.44TB at 93.3K, and the P5336 122.88TB at 83.0K, and ahead of the R6060 at 62.6K, the 6550 ION at 62.1K, and the J5060 at 54.7K. The 128K and 1M IOPS curves follow the throughput plateaus above, with the P5430 leveling just under 19K IOPS at 128K and about 3.8K IOPS at 1M once the Gen4 link saturates. GDSIO Sequential Read Latency At the light end of the sweep, the P5430’s single-thread 16K read latency of 27.8µs trailed only the two DapuStors, at 20.2µs for the J5060 and 22.1µs for the R6060, and edged the P5336 61.44TB at 28.4µs. The 6600 ION sat at 38.6µs, and the two drives that struggled at QD1 were the P5336 122.88TB at 82.1µs and the 6550 ION at 90.9µs, both of which pay a first-access penalty the P5430 doesn’t. As thread counts climbed, latency rose with queue depth, as it does for every drive in the group, and at 1M and 128 threads, the P5430 ended up around 33ms, above the Gen5 drives at 21ms but below the…

    Full show notes at the publisher

    NVIDIA RTX PRO 4500 Edge Review: 2.7x the L4 Inside an HPE ProLiant DL145 Gen11 Sep 24, 2026
    Show notes

    The NVIDIA RTX PRO 4500 Blackwell Server Edition is the card NVIDIA built primarily to replace the L4 in servers that live outside the data center: single-slot, PCIe Gen5, passively cooled, 165W, with 32GB of GDDR7 and the full Blackwell feature set, including FP4 Tensor Cores and Multi-Instance GPU. HPE sent us a ProLiant DL145 Gen11, the short-depth edge server it pairs with this GPU in its Nemotron edge solution, and we ran the same vLLM serving sweep on the RTX PRO 4500 and on an L4 in the same chassis. This RTX PRO 4500 edge review is about that one comparison: what a site that already runs an L4 in an edge box gets by swapping in the 4500, in tokens, in latency, and in power consumption. Across two small BF16 models at practical concurrency, the RTX PRO 4500 delivers 2.7x the L4’s output throughput, holds first-token latency under a second at loads where the L4 has already fallen into a queue, and raises the DL145’s whole-server draw from about 196W to about 301W to do it. Per GPU watt, the gain is 1.3 to 1.4x. Per card, it’s the difference between serving 32 to 64 concurrent chat sessions and serving 256. Per box, the DL145 takes up to three L4s, and three at 32 sessions each land close to one 4500 on throughput, so the 4500’s box-level case rests on per-user speed, latency, a single 32GB memory pool, and FP4. This is an edge server look at one card against its predecessor, on the Metrum AI® Bench Platform, with the models that fit comfortably in 24GB and 32GB. The RTX PRO 4500 Server Edition also belongs in a wider comparison against the rest of NVIDIA’s inference lineup, and we have that testing underway for a separate piece. For this one, the L4 is the most relevant comparison, and we’ve added a single RTX PRO 6000 Blackwell dataset only to show what NVFP4 on a 26B model looks like when there’s a bigger card to measure against. The RTX PRO 6000 isn’t supported in the HPE edge server. Key Takeaways 2.7x the L4 in the same server: Across 18 input and output combinations on Qwen3.5-4B and Gemma 4 E4B, the RTX PRO 4500 delivered a median 2.7x the L4’s output tokens per second at 8 to 32 concurrent requests, and 3.0x to 3.2x at 256, with both cards in the same HPE ProLiant DL145 Gen11. Latency is the bigger gap: The 4500 generates at 12 to 15ms per token against 35 to 40ms on the L4, and at 256 concurrent requests its median time to first token stayed at 264ms to 650ms on 256-token prompts, while the L4’s climbed to 9 and 39 seconds. 105W more at the wall, 2.7x the tokens: The DL145 drew about 196W serving on the L4 and about 301W on the 4500 at 32 concurrent. Output tokens per system watt went from 2.7 to 5.1 on Qwen3.5-4B and from 2.9 to 5.6 on Gemma 4 E4B. Per-user speed holds to 256 sessions on chat-shaped prompts: Dividing output by concurrency, the 4500 still gives every user 11 to 22 tokens per second at 256 concurrent on 256-token or longer answers to short and medium prompts, where the L4 has dropped to 3.7 to 8.7. The L4 falls under a 10 tokens per second floor between 32 and 256 sessions on most shapes and between 8 and 16 on the prefill-heavy 1,024/32 shape; the 4500 stays above it at 256 except on short-answer and 1,024-token-prompt shapes. 32GB and FP4 open a model class the L4 can’t run natively: On Gemma 4 26B-A4B in NVFP4 with an FP8 KV cache, the 4500 produced 1,613 output tokens per second at 32 concurrent at 165W, about half of what an RTX PRO 6000 Blackwell managed in a workstation while drawing 266 to 471W at 8 to 32 concurrent. At 256 concurrent, the gap widens to about 2.5x. What Is the RTX PRO 4500 Server Edition Designed For? NVIDIA announced the RTX PRO 4500 Blackwell Server Edition at GTC 2026 as the entry tier of its RTX PRO server family and the successor to the L4. It shares a name with the RTX PRO 4500 Blackwell workstation card, and the two share silicon and a 10,496 CUDA core count, but they’re different products. The Server Edition drops the display outputs and the fan, holds board power to 165W, and adds the data center feature set: MIG with up to two 16GB instances, confidential computing, a third NVENC and NVDEC, and vGPU support. NVIDIA rates its memory at 800GB/s and its FP4 Tensor peak at 1.6 PFLOPS with sparsity, and describes the card as a “power-efficient Blackwell GPU for enterprise AI” aimed at “mainstream data center and edge servers.” We covered this in our HPE GTC 2026 coverage. NVIDIA also changed the form factor: the L4 we reviewed in 2024 is a half-height, half-length, 72W card with 24GB of GDDR6 at 300GB/s, while the RTX PRO 4500 Server Edition is a full-height, full-length single-slot board at 165W, so it still takes one slot but needs a full-length riser and a 16-pin power feed. The DL145 Gen11’s standard slot is full-height, half-length, and HPE configured our unit with the full-length riser and power cable. On paper, the 4500 brings 2.7x the L4’s memory bandwidth, 33% more memory, and 1.7x the FP8 Tensor peak at 2.3x the power, plus an FP4 path the L4 has no hardware for. Specification RTX PRO 4500 Blackwell Server Edition NVIDIA L4 Platform Overview Architecture Blackwell Ada Lovelace CUDA cores 10,496 7,424 Memory 32GB GDDR7 with ECC 24GB GDDR6 Memory bandwidth 800GB/s 300GB/s Performance (NVIDIA peak figures, with sparsity) FP32 51 TFLOPS 30.3 TFLOPS FP8 Tensor 811 TFLOPS 485 TFLOPS FP4 Tensor 1.6 PFLOPS Not supported Power and Form Factor Board power 165W 72W Form factor Single slot, full height, full length, passive Single slot, half height, half length, passive Power connector 1x PCIe CEM5 16-pin Slot powered Interface PCIe 5.0 x16 PCIe 4.0 x16 Features MIG Up to 2 instances at 16GB No NVENC / NVDEC 3 / 3 2 / 4 Confidential computing Capable No The Edge Server: HPE ProLiant DL145 Gen11 HPE positions the DL145 Gen11 as the server for sites that don’t have a server room. Its solution brief for the DL145 and NVIDIA Nemotron describes a wall-mountable, near-silent box rated from -5C to 55C for cabinets with little airflow, dusty locations, and hot or cold sites, with iLO and Compute Ops Management for onboarding hundreds of locations that have only power and Ethernet. HPE suggests retail, healthcare, finance, manufacturing, and energy as the target industries, and the workloads it lists are the ones this review measures: small language models, RAG, and vector search running locally so latency-sensitive and regulated data never leaves the site. We reviewed the DL145 Gen11 when it launched, so we won’t repeat the platform tour here. The unit HPE sent for this testing is configured with a single AMD EPYC 8534P, a 64-core, 128-thread Siena part, 96GB of DDR5-4800 in six 16GB DIMMs, and the RTX PRO 4500 Blackwell Server Edition on the full-length riser. The chassis has a two-bay U.3 backplane; our unit shipped with SATA-only backplane cabling, so we booted from a 6.4TB Solidigm D7-P5620 NVMe SSD on a PCIe sled instead, which has no bearing on the GPU results. The L4 comparison used the same exact server configuration. The 4500 is the card HPE ships in this platform for its Nemotron edge solution; the L4 is what a DL145 owner from the last two years most likely has in that slot today. Two more platform numbers feed the analysis below: the DL145 reports whole-server power through iLO, and the Bench Platform logged it alongside the GPU’s own board power on every run, so we can talk about watts at the wall and watts at the card. And the server’s air path kept both passive cards inside their limits: the 4500 peaked at 84C average GPU temperature during the longest runs and the L4 at 86C, both under sustained full-power inference load in a 2U short-depth chassis. How We Tested All inference data in this review was collected with the Metrum AI Bench Platform (version 3.9.2, recorded in the run files under its former name, Metrum Insights), running vLLM 0.24.0 as the serving engine. The Bench Platform runs a fixed grid of scenarios against each system, records throughput, latency percentiles, GPU telemetry, and host power for every scenario, and exports the results as a single dataset per job. We’ve written about Metrum AI’s work with Oregon State before, and Dell used the same platform for its R770AP technical brief; this is the first time we’ve used it to drive our own GPU comparison end to end. Metrum AI’s engineers and our lab ran the jobs together, with the Bench Platform doing the collection and our team setting the hardware, the models, and the questions. Metrum AI also publishes an open-source companion, the Metrum AI Bench CLI, which readers can use to run the same style of tests on their own systems. Metrum AI is a registered trademark, and Metrum AI Bench CLI and Metrum AI Bench Platform are trademarks of Metrum AI, Inc. Use of Metrum AI Bench does not imply endorsement by Metrum AI. The grid is nine prompt shapes: every combination of 32, 256, and 1,024 input tokens with 32, 256, and 1,024 maximum output tokens, each run at 1, 8, 16, 32, and 256 concurrent requests, for 45 scenarios per model per GPU. The L4’s Gemma 4 run also included 64 and 128 concurrent requests, which turned out to be useful for finding its ceiling. Each scenario sends 15 requests per stream from 1 through 32 concurrent, and 1,280 requests at 256. The 4500’s Gemma 4 E4B job was run three times; scenario-to-scenario variance between repeats was under 2%, and we report the median. The L4 and 4500 BF16 jobs and the two Gemma 4 26B jobs, one on each card, come to 378 scenario runs, and across them there was one failed request in one repeat of one 4500 scenario, which we mention only for disclosure. Three models cover the test: Qwen3.5-4B and Gemma 4 E4B, both served in BF16 with a BF16 KV cache, are the two the L4 and the 4500 both ran, and they’re the size of model an edge deployment on a 24GB card is realistically serving today. Gemma 4 26B-A4B, a 26B mixture-of-experts model with about 4B active parameters, ran in NVFP4 with an FP8 KV cache on the 4500 only, with an RTX PRO 6000 Blackwell Workstation Edition (600W) in a Dell Pro Max Tower T2 as a reference point. The L4 has no native FP4 compute and no room for that model at BF16, so it sits out that part of the test. Three notes on reading the charts: we start the throughput plots at 8 concurrent requests. The single-request scenarios are short enough (15 requests, a few seconds each) that the first request of each single-user Qwen scenario on the 4500, which hit a 37 to 39 second first-token delay, skews the run’s throughput figure, so for the single-user case we report per-token latency and response time, which aren’t affected. GPU power is a sampled average, so we only compute tokens per watt from runs long enough for the average to settle, which in practice means 16 concurrent and up. And at 256 concurrent with long prompts, both cards run out of KV cache and vLLM queues requests; those points are still real throughput numbers, but the time-to-first-token figures at that load describe a queue, and we treat 32 concurrent as the working range for latency-sensitive use. Qwen3.5-4B The grid below is the whole Qwen3.5-4B comparison at a glance: output tokens per second on both cards at every prompt shape, from 8 to 256 concurrent requests. The same curve shape repeats across all nine panels, with the 4500 opening at about 2.5 to 2.8x the L4 at 8 concurrent, scaling a little faster through 32, and landing at 2.4x to 3.2x at 256. Taking the 256-in, 256-out shape as the chat-sized reference: at 8 concurrent, the L4 produced 192 output tokens per second and the 4500 529 (2.76x); at 32 concurrent, 532 against 1,529 (2.87x); at 256 concurrent, 935 against 2,821 (3.02x). The longest shape, 1,024 tokens each way, tracks it almost exactly: 499 against 1,445 at 32 concurrent and 715 against 2,181 at 256. The narrowest gap in the whole grid is the prefill-heavy 1,024-in, 32-out case, where the 4500 holds a steady 2.4x from 8 concurrent onward, because that workload is almost entirely prompt processing and both cards are compute-bound on it from the start. Qwen3.5-4B rises steadily on that shape on both cards. The one dip at 16 concurrent in the BF16 grids is the 4500 running Gemma 4 E4B on 1,024/32, which showed up in all three repeats; we haven’t isolated the cause. For a single user, the throughput ratio understates the difference, because what a person sees is how fast the words appear. On the 256/256 shape, the 4500 generated at a median 12.4ms per token, the L4 at 35.0ms, so a 256-token answer took about 3.2 seconds on the 4500 and 9.0 seconds on the L4. At 1,024 tokens each way, it was 13.1 seconds against 36.6 seconds. First-token latency for that lone user was 43ms on the 4500 and 81ms on the L4 for the shorter prompt, 99ms against 219ms for the longer one. Under load, the latency gap widens: at 32 concurrent on the 256/256 shape, the L4’s median time to first token was 884ms and the 4500’s was 386ms. At 256 concurrent, the L4 went to 39 seconds, while the 4500 held at 650ms. On 1,024/1,024, the L4 was already over a second at 32 concurrent (1,022ms) and reached 255 seconds at 256, which is a request sitting in vLLM’s queue for four minutes waiting for the KV cache to free up. The 4500 crossed the one-second line on that shape only at 256 concurrent, at 12.9 seconds. In the chart below, the L4’s lines leave the plot area between 32 and 256; the 4500’s stay under a second on the shorter shape all the way out. Another way to read the same data is per user: output tokens per second divided by the number of concurrent requests, which is the rate each person in the queue sees, plotted in the grid below for every shape against a 10 tokens per second floor that serves as a common threshold for interactive use. At 32 concurrent, the 4500 delivers 44 to 53 tokens per second per user on every shape except 1,024-in, 32-out, where it’s 11, while the L4 sits at 10 to 18 and has already dropped to 4.6 on that same shape. At 256 concurrent the 4500 stays above the floor on the four chat-shaped combinations (14.1 on 32/256, 12.7 on 32/1,024, 11.0 on 256/256, and 11.6 on 256/1,024), lands on it at 9.9 on 32/32, and falls under it on the 1,024-token prompts and the short-answer shapes, down to 1.5 on 1,024/32 where nearly all of the work is prefill. The L4 is under the floor on every shape at 256, between 0.6 and 4.5. Nothing was tested between 32 and 256, so the point where each line crosses the dotted floor sits somewhere between those two concurrencies; what the chart shows is that the L4’s crossing comes well before 256 on every shape, and the 4500’s comes at or near 256 on the chat shapes. Both cards ran at or near their board power limits, 72W for the L4 and 165W for the 4500, on most shapes from 16 concurrent up. The short-output shapes ran lower, such as 125W on the 4500 for Qwen3.5-4B 32/32 at 32 concurrent, so tokens per GPU watt tracks throughput closely. At 256 concurrent, the 4500 produced a median 1.33x the L4’s output tokens per watt across the nine shapes, from 1.07x on the prefill-bound 1,024/32 case to 1.39x on 256/1,024. Multiply that by the 2.3x power difference, and you get the 3x throughput lead, with the 1.33x coming from Blackwell doing more per watt and the 2.3x from the 4500 spending more watts. Gemma 4 E4B Gemma 4 E4B is the small member of Google’s Gemma 4 family, the E standing for an effective 4B parameters, and it behaves like Qwen3.5-4B on both cards with slightly better scaling at the top of the grid. The median throughput ratio at 8 to 32 concurrent is 2.67x (range 2.31x to 3.07x), and at 256 it’s 3.20x, with the 1,024/1,024 shape reaching 3.82x because the L4 is so deep into its KV cache limit there. On the 256/256 shape, the L4 produced 183 output tokens per second at 8 concurrent, 577 at 32, and 1,269 at 256; the 4500 produced 479, 1,678, and 4,058. On 1,024/1,024, the L4 went 180, 524, 826, and the 4500 went 480, 1,454, 3,154. The 4500’s 256-concurrent figure on the long shape is 3.8x the L4’…

    Full show notes at the publisher

    QNAP TS-432XeU Brings 10GbE to a 12-Inch-Deep 1U NAS Sep 24, 2026
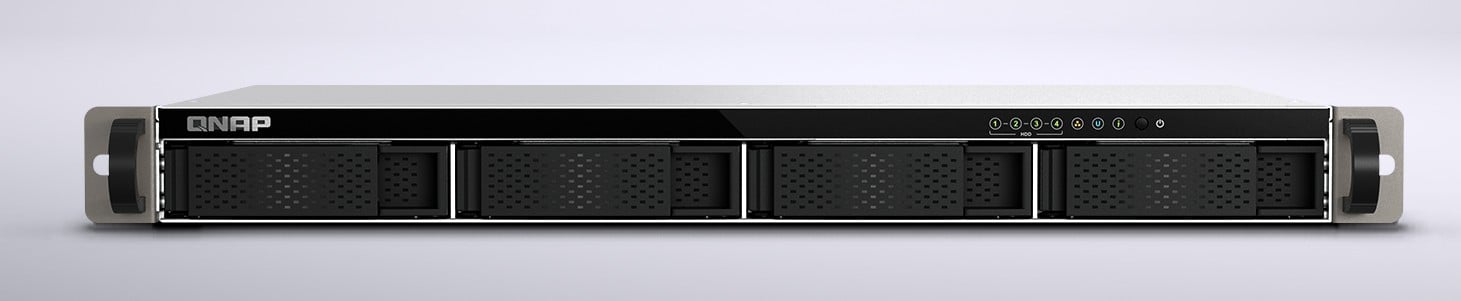
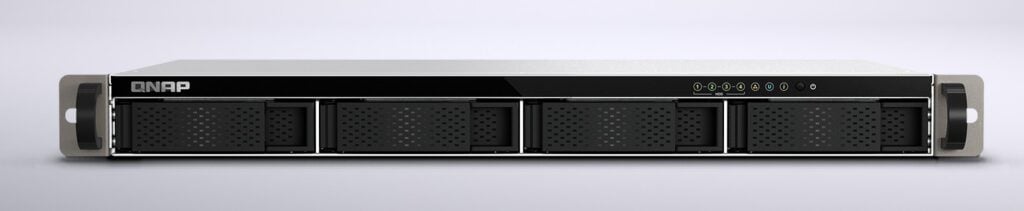
    Show notes QNAP TS-432XeU front panel with four hot-swappable drive trays, status LEDs, and rack ears on the 1U short-depth chassis, vendor render QNAP TS-432XeU front panel with four hot-swappable drive trays, status LEDs, and rack ears on the 1U short-depth chassis, vendor render

    QNAP has introduced the TS-432XeU, a 4-bay short-depth rackmount NAS that combines 10GbE SFP+ and dual 2.5GbE networking in a 1U chassis measuring just over 292mm deep. The compact design is intended for installations where a conventional full-depth rackmount NAS may not fit, including wall-mounted network cabinets, small server rooms, factory floors, surveillance environments, and AV installations.

    QNAP TS-432XeU front panel with four hot-swappable drive trays, status LEDs, and rack ears on the 1U short-depth chassis, vendor render

    The TS-432XeU uses the Annapurna Labs Alpine AL324, a 64-bit ARM Cortex-A57 processor with four cores running at 1.7GHz. The AL324 is a familiar platform in QNAP’s lineup, having previously appeared in systems including the TS-832PX, TS-932PX, and TS-432PXU. The new system pairs it with 4GB of DDR4 memory, expandable to 16GB through its single SODIMM slot. Its four hot-swappable SATA bays accommodate either 3.5-inch SATA HDDs or 2.5-inch SATA SSDs.

    12-Inch Short-Depth 1U Design

    At 43.3 × 430 × 292.12mm, the TS-432XeU is considerably shallower than a conventional rackmount server or storage system. The roughly 12-inch chassis can be installed in compact racks and wall-mounted cabinets, with QNAP also listing factories, small offices, security monitoring rooms, media studios, and vehicle-based installations among the supported deployment environments.

    The four SATA bays support 6Gb/s and 3Gb/s drives along with SSD cache acceleration. External storage expansion is available through compatible QNAP JBODs, including the 4-bay TR-004U and the 12-bay TL-R1200C-RP.

    10GbE and Dual 2.5GbE Networking

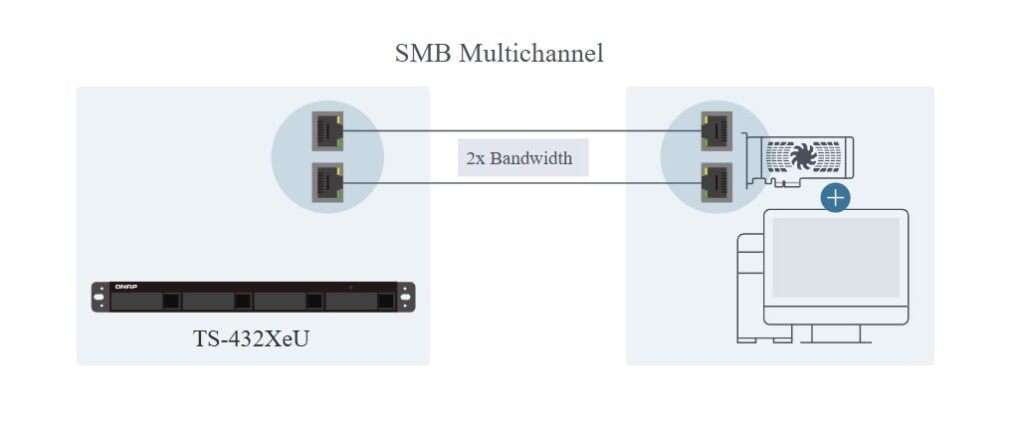
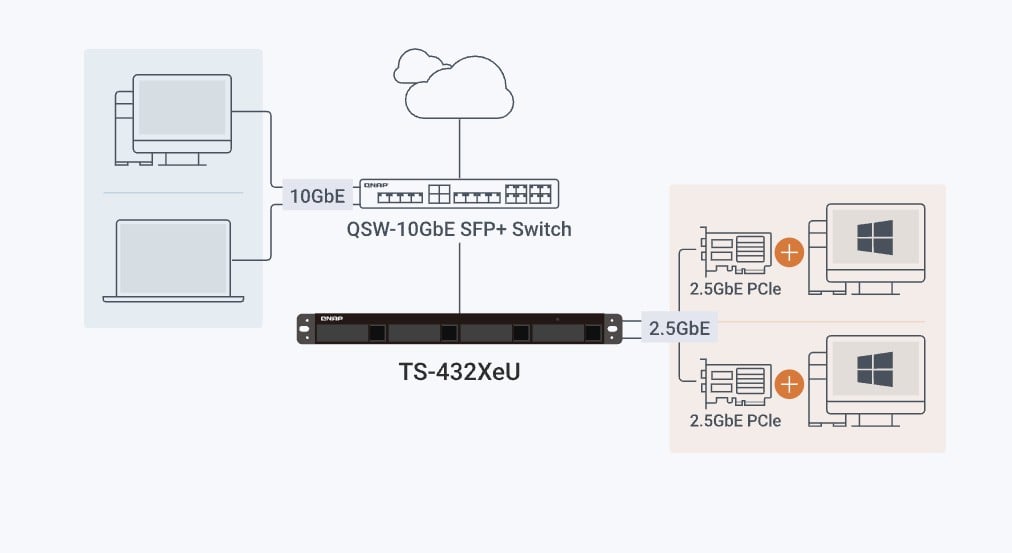
    Network connectivity includes one 10GbE SFP+ port and two 2.5GbE RJ45 ports. The two 2.5GbE interfaces support SMB Multichannel, allowing a compatible client to use both connections for additional bandwidth, as well as port trunking for environments serving multiple simultaneous clients. The 10GbE SFP+ interface provides a separate higher-bandwidth connection for storage traffic.

    QNAP TS-432XeU SMB Multichannel diagram showing two 2.5GbE links to a PC with a dual-port NIC for twice the bandwidth, vendor diagram

    The TS-432XeU also has four USB 3.2 Gen 1 ports supporting speeds up to 5Gbps. These can be used with external HDDs and SSDs, flash drives, and compatible QNAP USB JBOD enclosures for backup, data import, cold storage, or additional capacity.

    QNAP TS-432XeU network diagram with the 10GbE SFP+ port connected through a QNAP 10GbE switch to clients and 2.5GbE links to Windows PCs, vendor diagram

    Backup, Containers, and Surveillance

    In addition to file storage, the TS-432XeU supports scheduled snapshots and QNAP’s backup applications for NAS and file servers, cloud services, Mac systems, Microsoft 365, Google Workspace, and other endpoints. Rsync, FTP, and CIFS/SMB are supported for file-server backup, while the NAS can also serve as an Apple Time Machine destination. QNAP’s synchronization tools provide cross-device sync, version control, custom synchronization rules, and shared team folders.

    Container Station provides Docker container support for applications, development environments, sandboxes, and microservices. The ARM-based processor should be considered when selecting container images, as applications need to support the platform’s 64-bit ARM architecture.

    The TS-432XeU can also be used for surveillance, with support for ONVIF cameras, centralized video management, video backup, and server-side AI analysis. Recordings can be stored on compatible QNAP JBOD expansion enclosures or backed up to QVR Recording Vault and myQNAPcloud Surveillance.

    Security and Management

    The TS-432XeU supports AES-256 encryption and integrates with Windows AD, Azure AD, and LDAP. Account security options include passwordless login and two-factor authentication, while QVPN Service and QuWAN provide VPN and multi-site connectivity options.

    QNAP also includes QuFirewall for IP- and region-based access controls, Security Center for monitoring NAS status and unusual file activity, Notification Center for centralized system alerts, and Malware Remover. SMB signing acceleration is supported for secured SMB file transfers.

    QNAP TS-432XeU Specifications

    Specification QNAP TS-432XeU-4G
    CPU Annapurna Labs Alpine Quad-core ARM Cortex-A57 CPU 1.70GHz processor
    CPU Architecture 64-bit ARM
    Encryption Engine Yes
    System Memory 4GB SODIMM DDR4
    Maximum Memory 16GB (1 × 16GB)
    Memory Slots 1 × SODIMM DDR4
    Flash Memory 4GB (Dual boot OS protection)
    Drive Bays 4 × 3.5-inch SATA 6Gb/s, 3Gb/s
    Drive Compatibility 3.5-inch SATA HDDs
    2.5-inch SATA SSDs
    Hot-swappable Yes
    SSD Cache Acceleration Yes
    10GbE 1 × 10GbE SFP+
    2.5GbE 2 × 2.5GbE (2.5G/1G/100M)
    Wake on LAN Yes
    Jumbo Frame Yes
    USB 4 × USB 3.2 Gen 1 (5Gbps)
    Form Factor 1U Short Depth Rackmount
    LED Indicators HDD 1-4, Status, LAN, USB
    Buttons Power, Reset
    Dimensions (H × W × D) 43.3 × 430 × 292.12mm
    Excludes ear hook and the protruding part of the power supply unit.
    Net Weight 4.91kg
    Gross Weight 5.82kg
    Operating Temperature 0 to 40°C (32 to 104°F)
    Storage Temperature -20 to 70°C (-4 to 158°F)
    Relative Humidity 5 to 95% RH non-condensing, wet bulb: 27°C (80.6°F)
    Power Supply 100W PSU, 100 to 240V
    Fans 3 × 40mm, 12VDC
    System Warning Buzzer
    Kensington Security Slot Yes
    Standard Warranty 3 years
    Maximum Concurrent CIFS Connections 1,500

    QNAP TS-432XeU Pricing and Availability

    The QNAP TS-432XeU-4G with 4GB of DDR4 is available now, with U.S. retail listings at $679. QNAP includes a three-year warranty and offers extensions of up to five years.

    QNAP TS-432XeU Product Page

    The post QNAP TS-432XeU Brings 10GbE to a 12-Inch-Deep 1U NAS appeared first on StorageReview.com.


    Datadobi Data Access Governance Hits GA in StorageMAP, Mapping Who Can Access Unstructured Data Sep 24, 2026
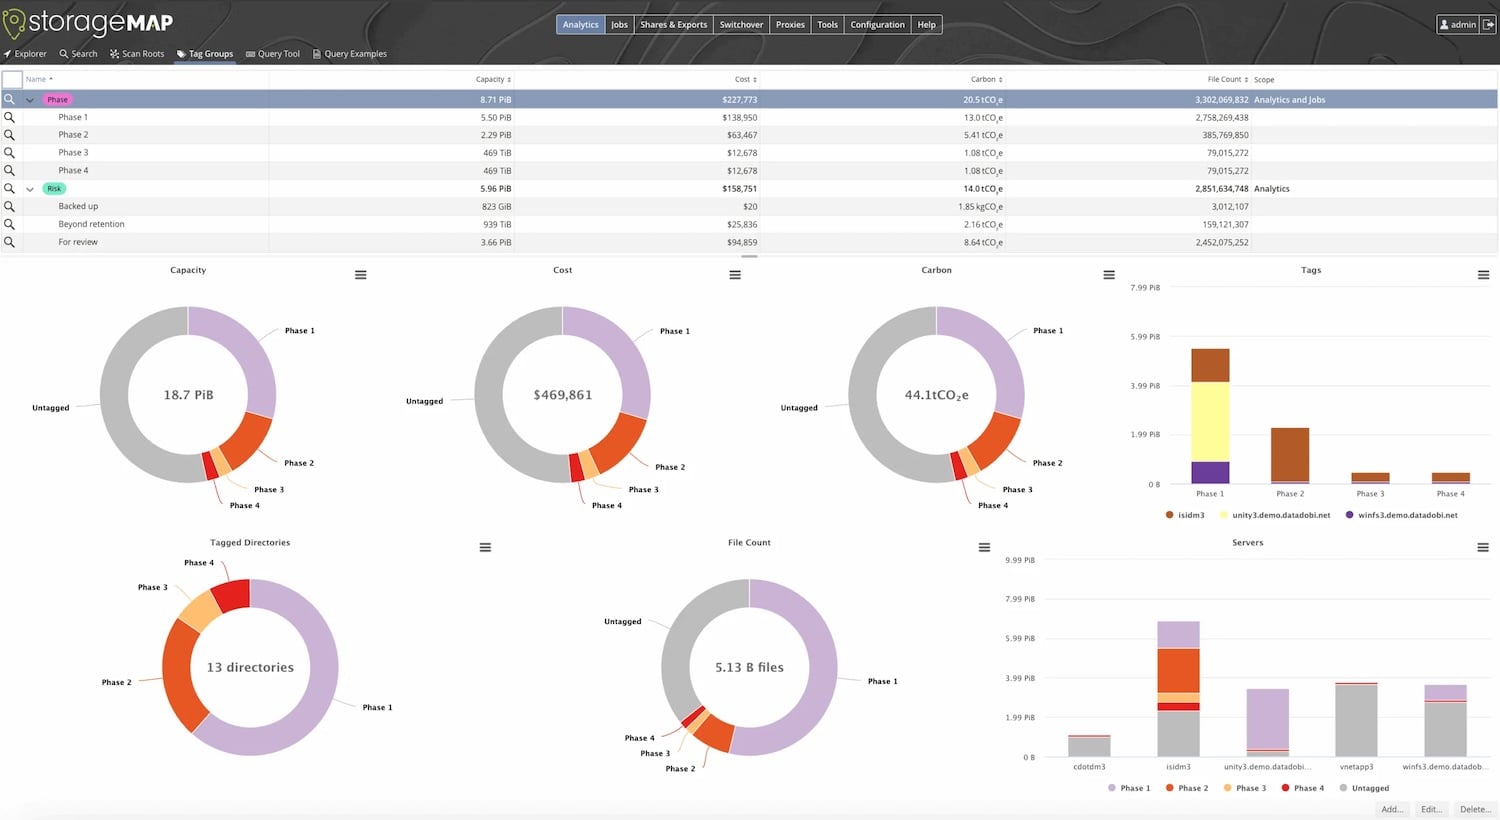
    Show notes StorageMAP Analytics view with tag groups broken out by capacity, cost, carbon, and file count, the console where Datadobi Data Access Governance now runs, vendor screenshot StorageMAP Analytics view with tag groups broken out by capacity, cost, carbon, and file count, the console where Datadobi Data Access Governance now runs, vendor screenshot

    Datadobi has made Data Access Governance (DAG) generally available in StorageMAP, giving organizations visibility into who has access to their unstructured data and whether that access aligns with corporate policy. DAG surfaces access permissions across fragmented unstructured data environments so administrators can detect misaligned permissions, reduce cyber exposure, and enforce governance at scale.

    StorageMAP Analytics view with tag groups broken out by capacity, cost, carbon, and file count, the console where Datadobi Data Access Governance now runs, vendor screenshot

    Permission Visibility and Security Exposure Controls

    Datadobi positions DAG as the first stage of its Data Storage Management Services (DSMS) discipline, which runs from visibility through understanding, decision, and execution. The capability opened as an early access program for StorageMAP customers in February under the name Data Access Review, and Datadobi says those early access customers identified gaps in understanding which critical datasets were exposed and who could access them. The company lists three use cases for DAG: protecting sensitive data and reducing breach impact, maintaining records compliance, and managing risk through mergers, acquisitions, and divestitures.

    Where DAG Fits in StorageMAP

    DAG extends StorageMAP’s existing capabilities across data discovery, classification, risk assessment, lifecycle management, and AI Data Readiness, which Datadobi says together help organizations discover what data they have, align it with business value and risk requirements, and act on policy across their environments. We last covered the platform when Datadobi added orphaned data management to StorageMAP in 2022.

    “Unstructured data is at the center of every major enterprise challenge right now including AI readiness, cyber resilience, cost management, and regulatory compliance. But organizations cannot address any of those challenges with data they cannot see or control,” said Michael Jack, co-founder and Chief Revenue Officer at Datadobi. “Data Access Governance gives teams the visibility to understand who has access to what, identify where risk exists, and take action to bring their unstructured data under control.”

    Datadobi StorageMAP Product Page

    The post Datadobi Data Access Governance Hits GA in StorageMAP, Mapping Who Can Access Unstructured Data appeared first on StorageReview.com.


    ASUS ExpertCenter Pro ET900N G3 Review: The GB300 DGX Station Gets Handles, Titanium Power, and Cooled Optics Sep 23, 2026
    Show notes

    The ASUS ExpertCenter Pro ET900N G3 is the second GB300 DGX Station we’ve tested and the first we’ve had hands-on in the lab; our MSI XpertStation WS300 testing ran remotely. It uses the same NVIDIA silicon we tested in the MSI XpertStation WS300: a Grace Blackwell Ultra Desktop Superchip with 72 Grace cores, a B300 GPU, 252GB of HBM3e, 496GB of LPDDR5X, and a ConnectX-8 SuperNIC with two 400GbE ports. ASUS packages that fixed core platform in a tidy tower built for deskside AI, adding a few touches not found on the WS300: two carry handles on top, a dedicated fan aimed at the ConnectX-8 optics cages, and a 1,600W power supply rated 80 PLUS Titanium. ASUS shipped the ET900N G3 to the lab for about a week of benchmarking, photography, and physical checks, with an RTX PRO 2000 installed. For the platform itself, the B300, Grace, NVLink-C2C, MIG, and what a DGX Station is for, the WS300 review covers that ground. This review is about what ASUS built around the Superchip, and whether the numbers hold up against the first GB300 tower we tested. ASUS ExpertCenter Pro ET900N G3 Specifications Specification ASUS ExpertCenter Pro ET900N G3 Platform Overview Superchip NVIDIA GB300 Grace Blackwell Ultra Desktop Superchip CPU NVIDIA Grace, 72 Arm Neoverse V2 cores GPU NVIDIA Blackwell Ultra (B300), up to 20 PFLOPS NVFP4 with sparsity CPU-GPU Interconnect NVLink-C2C, 900GB/s bidirectional Memory Coherent Memory 748GB GPU Memory 252GB HBM3e, 7.1TB/s CPU Memory 496GB LPDDR5X, 396GB/s, 4x SOCAMM Storage Boot Drives 2x M.2 2280 PCIe 5.0 x4 (Key M), populated with 2x 2TB NVMe in RAID 1 Expansion Drives 2x M.2 2280 (Key M), PCIe 6.0 x4 per ASUS, open from the factory Networking SuperNIC NVIDIA ConnectX-8, 2x QSFP112 400GbE Ethernet 1x Marvell 10GbE1x Realtek 1GbE (BMC) Expansion PCIe Slots 1x PCIe 5.0 x162x PCIe 5.0 x16 (x8 signals) Add-in GPU Up to one NVIDIA RTX PRO Blackwell card; review unit shipped with an RTX PRO 2000 Blackwell I/O Front 2x USB 10Gbps Type-C2x USB 10Gbps Type-A1x USB 2.0Headphone and microphone jacks Rear 4x USB 10Gbps Type-A1x Micro-USB COM (BMC serial console)1x Mini DisplayPort (BMC)3x audio jacks Management and Security BMC ASPEED AST2600 with AMI MegaRAC firmware, IPMI and Redfish Security Onboard TPM 2.0 Power and Cooling Power Supply 1x 1,600W ATX, 80 PLUS Titanium Cooling Closed-loop AIO liquid cooling (per ASUS) with cold plates on the GB300, SOCAMM, and ConnectX-8; front and top radiators, rear chassis fan, dedicated fan over the QSFP112 cages Operating Temperature 10C to 35C Software and Form Factor Operating System Ubuntu with NVIDIA AI developer tools; ASUS says Windows-based AI development support is planned Dimensions 584 x 232 x 565mm (23.0 x 9.1 x 22.3 in), as listed by ASUS Weight 27kg net, 32kg gross Design and Build ASUS dresses the ET900N G3 as a business workstation, with a brushed silver chassis, a dark mesh front, a chrome-trimmed cap and foot, and an ASUS badge low on the front. The proportions are what the platform dictates: 584 x 232 x 565mm by ASUS’s listing, which works out a little taller and a touch narrower than the WS300 at 529mm high, 570mm deep, and 246mm wide. At 27kg, it isn’t a system anyone moves casually, and that’s where the first ASUS-specific decision comes into play. Two metal handles on the top edge, one at the front and one at the rear, let two people lift the tower onto a desk or into a cart without grabbing the panels. They look slightly out of place on an office machine until you’ve had to carry a GB300 tower across a lab. The front panel features the power button, two 10Gbps USB Type-A ports, two 10Gbps USB Type-C ports, a USB 2.0 port, and separate headphone and microphone jacks, all arranged in a vertical strip at the upper right of the mesh. The side panel is a large vented slab, with a long perforated column toward the front for the radiator intake and a smaller square grille toward the rear that lines up with the system fans. There’s no window and no lighting, which suits the target buyer. Around back, the layout separates the workstation I/O from the server hardware underneath. The upper cluster holds the four 10Gbps USB Type-A ports, the 10GbE and 1GbE RJ45 jacks, the three audio jacks, the BMC’s Micro-USB console port, and the Mini DisplayPort that the BMC drives for setup. The two QSFP112 cages for the ConnectX-8 sit at the top of the I/O shield; an exhaust fan sits beside them; the three expansion slot covers run down the middle; and the power supply with its C19 inlet is at the bottom. As on the WS300, the Mini DisplayPort is a BMC output for initial setup and troubleshooting; anyone who wants a desktop on this machine needs the RTX PRO card. Inside the ET900N G3 With the side panel off, the ET900N G3 appears to be a close relative of the WS300, which is expected, given that both share the same NVIDIA baseboard. The GB300 Superchip sits under a copper cold plate assembly on the left of the chassis, with the SOCAMM modules under their own copper plates beside it and the ConnectX-8 under a third block near the rear I/O. Braided tubing runs from the blocks to a distribution manifold mounted on the chassis crossmember, and from there to the radiators. The three full-length PCIe slots sit below the Superchip, the power supply occupies the lower front corner, and a metal shroud covers the cable path along the bottom. The arrangement inside follows the same pattern as the WS300: one radiator mounted vertically behind the front mesh and a second along the top, each with a row of fans, plus a chassis fan at the rear. The coolant lines are sleeved and secured to the crossmember with hook-and-loop straps, and the manifold consolidates the runs from the four cold plates so that only two lines reach each radiator. The optics fan The one cooling element that has no equivalent in the WS300 is a small fan mounted on a bracket above the ConnectX-8 cold plate, aimed at the QSFP112 cages. The liquid loop handles the SuperNIC silicon itself, but 400G optical transceivers generate their own heat and sit in metal cages that the cold plate can only reach by conduction. In other testing, we’ve noted that the ConnectX-8 gets warm under sustained load and that the optics themselves can run hot, so a dedicated airflow path across the cages is a nice design element for anyone planning to run the ET900N G3 on fiber for hours at a time. With DACs, which is how we cabled it to a second GB300 Station for a clustered-inference deep dive that’s still in progress, the fan has less to do. Storage, expansion, and power ASUS shipped the ET900N G3 with a single 2TB NVMe drive for the operating system and NVIDIA software stack, in the pair of M.2 2280 slots attached to Grace over PCIe 5.0 x4. The second pair of slots hangs off the ConnectX-8’s integrated PCIe switch and shipped empty. Our review unit arrived with an NVIDIA RTX PRO 2000 Blackwell in the PCIe 5.0 x16 slot, which is one of the configurations ASUS lists. The card provides display output without drawing significantly from the GB300’s power budget, and ASUS says the chassis can accommodate up to one RTX PRO Blackwell card. We pulled the RTX PRO 2000 before benchmarking so the Superchip had the full accelerator budget, the same condition we used for the WS300, and we didn’t test a high-power RTX PRO card in this chassis; that path, and what it does to the shared power budget, is something we’ll cover in a coming GB300 Station review. The power supply is a 1,600W ATX unit that ASUS rates at 80 PLUS Titanium, a step above the Platinum unit in the WS300. Titanium requires 94% efficiency at 50% load on 115V input compared with 92% for Platinum, and it is the only tier that sets a floor at 10% load, so the ET900N G3 should waste a few tens of watts less at the wall under a full GB300 load. The budget is still shared: Grace, the B300, the pumps, fans, storage, and any RTX PRO card draw from the same 1,600W, and NVIDIA’s vsloshd service shifts headroom between the Superchip and an add-in GPU as their draw changes, with no fixed cap on either. The WS300 review walks through that policy, and it’s unchanged here. A dedicated 20A circuit remains the requirement for North American installs. Connectivity The ConnectX-8’s two QSFP112 ports are the ET900N G3’s link to everything else: storage, a second DGX Station, or a cluster fabric. Those ports are already in use in the lab, with the ET900N G3 cabled to a second GB300 Station over 400G DACs for a clustered-inference deep dive we’ll publish separately. The 10GbE Marvell port handles ordinary host traffic, and the Realtek 1GbE port is dedicated to the BMC. Testing Notes Every result in this review comes from the unit ASUS shipped to our lab, in the shipping memory configuration with 252GB of HBM3e and 496GB of LPDDR5X. The system ran without an RTX PRO card installed, so the GB300 Superchip had the full accelerator power budget, matching the conditions of our WS300 testing. The software stack, vLLM configuration, workload profiles, and concurrency sweep are the same as those we used for the WS300, so the two towers can be compared directly. This review is performance only; we didn’t instrument power draw or thermals on this unit. The workloads are the same two vLLM live-inference profiles we run on every local AI system: an equal workload with 512 input and 512 output tokens, and a prefill-heavy workload with 8,192 input and 1,024 output tokens, swept from one to 128 concurrent streams. For the frontier-scale models, we compare against a Dell PowerEdge XE7740 GPU server fitted with two or four RTX PRO 6000 cards, the nearest single-box alternative for these checkpoints. For the smaller models, we compare against a single RTX PRO 6000 in the same XE7740, a single H200 NVL in a Dell PowerEdge R770, and a GB10 DGX Spark represented by the Acer Veriton GN100, the same Spark we used in the WS300 review. All figures below are exact values from each system’s run logs, and the DGX Spark results carry over from our WS300 testing. Inference Performance Frontier models on the coherent memory pool The GB300’s reason to exist is serving models on either side of the B300’s 252GB HBM3e boundary, so we start with four checkpoints that span it: DeepSeek V4 Flash and MiniMax M2.7 fit in HBM with room to spare, MiniMax M3 barely fits and pushes a slice of its experts to Grace memory, and GLM-5.2 offloads roughly half its weights. On the other side of each chart is the nearest single-box alternative: RTX PRO 6000 cards together in the PowerEdge XE7740, with expert offload to host memory where needed. DeepSeek V4 Flash is the easy case: a native FP8 checkpoint of about 20GB that the B300 serves without effort. Output throughput on the same workload climbed from 152 tokens per second with 1 stream to 1,766 with 32 streams, bringing total token throughput to 3,532. On the prefill-heavy profile, the ET900N G3 increased from 148 to 954 output tokens per second, with a total of 8,587 tokens. Across the same 1 to 32 stream range, a pair of RTX PRO 6000 cards reached 803 output tokens per second on the equal workload and 489 on the long prompts, with an uneven curve at low concurrency. MiniMax M2.7 in NVIDIA’s NVFP4 quantization occupies about 125GB of HBM and scaled the furthest of the four. The equal workload rose from 214 output tokens per second on one stream to 4,793 on 128 streams, and total throughput reached 9,586. The prefill-heavy run scaled to 1,744 output tokens per second and 15,700 total tokens per second at 64 streams. Two RTX PRO 6000 cards followed the same shape at less than half the height, reaching 1,932 output tokens per second at 128 streams on the equal workload and 511 on the long prompts. MiniMax M3 shows what it’s like to barely fit into memory. The NVFP4 checkpoint is smaller than 252GB, but the runtime and KV cache also need space, so a portion of the experts resides in Grace memory, and every decode step that touches them crosses NVLink-C2C. With EAGLE3 speculative decoding, the ET900N G3 reached 1,041 output tokens per second at 32 streams on the equal workload, and the prefill-heavy profile peaked at 282 at two streams, held 271 at four, and fell to 103 at eight as the long prompts consumed the remaining cache. Four RTX PRO 6000 cards with the same speculative decoder matched the Station at one and two streams, pulled ahead from four streams to 1,181 output tokens per second at 16, then fell back to 759 at 32 streams. On the prefill-heavy profile, the four-card box held about 349 output tokens per second at four streams to the Station’s 271. A model that sits right at the HBM boundary is the one place in this set where 384GB of VRAM across four cards competes with 252GB of HBM plus offload. GLM-5.2 is the use case that only the coherent pool makes possible. The NVFP4 checkpoint keeps about 215GB of expert weights in Grace memory with MTP speculative decoding, and the ET900N G3 served it at 35 output tokens per second for one stream and 139 for 32 streams on an equal workload, with total throughput reaching 277. On the prefill-heavy profile, the sweep ran to 32 streams, reaching 120 output tokens per second and 1,079 total tokens. Four RTX PRO 6000 cards, each offloading about 30GB to host memory, managed about 40 output tokens per second at 32 streams, flattening to roughly 9 to 10 on long prompts from four streams onward. Neither system makes a 433GB model feel fast, but the GB300’s 396GB/s LPDDR5X and 900GB/s NVLink-C2C path to offloaded experts keeps scaling where PCIe-attached host memory across four cards stops. Set against the MSI WS300, the ET900N G3’s frontier-model results land within about 1% at every point we can compare: 1,766 output tokens per second on DeepSeek V4 Flash at 32 streams on both towers, 4,793 versus 4,801 on MiniMax M2.7 at 128, 1,041 on MiniMax M3 at 32 on both, and 139 on GLM-5.2 at 32 on both. Shared models against the RTX PRO 6000, H200 NVL, and DGX Spark The second half of benchmarking uses models small enough for every system to serve: GPT-OSS-20B and 120B in native MXFP4; Llama 3.1 8B in BF16 and FP8; Mistral Small 24B in BF16 and FP8; and Qwen3 Coder 30B in BF16 and FP8. New since the WS300 review is a single H200 NVL, NVIDIA’s 141GB Hopper card, which gives the comparison a data center accelerator one generation back. GPT-OSS-20B is the friendliest test of the set, a checkpoint every system holds comfortably, and on the equal workload the ET900N G3 scaled to 22,041 output tokens per second at 128 streams, or 44,082 total, against 7,937 for the RTX PRO 6000, 6,022 for the H200 NVL, and 1,469 for the DGX Spark. In single-stream mode, the Station produced 536 output tokens per second, compared to the card’s 241, the H200’s 270, and the Spark’s 50. The prefill-heavy profile widened the gap: 9,555 output tokens per second and 85,994 total at 128 streams for the Station, with the RTX PRO 6000 at 2,482, the H200 NVL at 3,419, and the Spark at 468. GPT-OSS-120B is where memory starts to sort the field. The ET900N G3 reached 9,280 output tokens per second on the equal workload at 128 streams, roughly three times the RTX PRO 6000 at 3,064, 2.7 times the H200 NVL at 3,376, and more than 18 times the Spark at 500. Under long prompts, the smaller systems finished far below the Station: the RTX PRO 6000 reached 1,169 output tokens per second at 128 streams and the H200 NVL 1,825, while the Station was still climbing at 128 streams and finished at 5,023, with a total throughput of 45,205 tokens per second. Llama 3.1 8B at FP8 is the highest single number in the set. The ET900N G3 pushed 25,602 output tokens per second across 128 streams on the equal workload, 51,205 total, compared with 8,073 for the RTX PRO 6000 and 11,054 for the H200 NVL. Dropping from BF16 to FP8 lifted the Station by about 50% (from 17,074 to 25,602), while the RTX PRO 6000 gained about 70% and the H200 NVL about 37% from the same change. The prefill-heavy profile compressed…

    Full show notes at the publisher

    1 2 3 Next

    Related Podcasts

    Reply All

    1

    Reply All Games & Hobbies
    Inside VR & AR

    2

    Inside VR & AR Gadgets
    Note to Self

    3

    Note to Self News
    BrainStuff

    4

    BrainStuff Natural Sciences
    This Week in Tech (Audio)

    5

    This Week in Tech (Audio) News
    Hands-On Tech (Audio)

    6

    Hands-On Tech (Audio) Technology
    footer-logo

    Contact Us

    Toll Free: 844-670-7747

    Links

    • Home
    • Top Charts
    • Networks
    • Apps
    • Independents Podcasts
    • Podcast Advertising
    • Podcast News
    • Contact Us
    • About Us
    • Analytics & Insights

    Stay Connected

      Privacy, Terms of Use & Our Code of Ethics Protecting Content Creators Copyrights