We are now sponsored by Qlik. You can download it for free here.

Great episode here folks! We have Stamen‘s CEO Eric Rodenbeck on the show to talk about “Visualization Going Mainstream”. Moritz took inspiration from Eric’s Eyeo talk “And Then There Were Twelve – How to (keep) running a successful data visualization and design studio.” and decided he must come on the show.
Stamen is a design studio in San Francisco founded in 2001 by Eric. They have been real pioneers in data visualization and cartographic mapping with the production of great apps and libraries such as Pretty Maps, Trulia Hindsight, Crimespotting and many many more. (See also our episode with Mike Migurski)
With Eric we discuss a broad range of important topics including: how to manage a vis business, how to have an impact with visualization and visualization success stories.
Enjoy the show!
LINKS
TRANSCRIPT
Thanks to Mary from Two Main, this episode has a full transcript! Thanks so much, Mary!
MORITZ STEFANER: Hey everyone, Data Stories #48. Moritz here. Hey, Enrico, how are you doing?
ENRICO BERTINI: I’m doing great.
MORITZ STEFANER: Yeah? Very good?
ENRICO BERTINI: Getting buried by snow, yeah.
MORITZ STEFANER: I was about to ask you about the weather. I finally have a good reason to ask you because there’s a big “blizzmas” in New York, right?
ENRICO BERTINI: Yeah, I don’t know. It didn’t seem to happen. I’m so disappointed. I don’t know. The news was very bad yesterday, but I don’t know. Doesn’t look like a big storm so far, and the kids are having lots of fun around here playing with the snow.
MORITZ STEFANER: So everybody takes time off work and plays in the snow. Nothing bad about that.
ENRICO BERTINI: Yes, it was just perfect yesterday. I was supposed to teach at 6:00, and NYU sent me a message around noon or so saying that after 4:00 pm everything is cancelled. So I just tried to have some fun with the kids – nothing special. Well, actually special. How about you?
MORITZ STEFANER: Yeah, nothing special. Just catching up with projects. I mean we just recorded the other episode so there’s no big updates from me. But if you listen to that, you know what I’m up to, so I think we can dive right in. And today we have a really super special guest, and it came when I was just catching up on Eyeo talk. So I missed last year’s Eyeo. I don’t know how that happened, but somehow it did. And so I had to catch up on Vimeo, and I saw Eric Rodenbeck’s talk. And the minute after I finished the talk I wrote him an email to invite him to Data Stories because it touched on so many things that are important to me and I’ve been thinking about. It wasn’t very personal – just a great talk. And so I thought we should have him on the show, and here he is. Hey Eric.
ENRICO BERTINI: Hi Eric, welcome.
ERIC RODENBECK: Hello.
MORITZ STEFANER: Great to have you here.
ENRICO BERTINI: Very glad you’re here.
ERIC RODENBECK: Thank you.
MORITZ STEFANER: That’s really fantastic. I mean Stamen has been on our list for a long time. We had Mike Migurski, so it was sort of halfway covered, but of course now with Eric we have the real deal and it can sort of follow up on the second half. And all of our listeners, you should now, if you have the chance now, if you’re not on the bus or somewhere, ideally pause and go to the Vimeo link we put on the blog post and first watch the Eyeo talk because I think we will just pick up where he left off at this point, and we will refer to many of the points there. And as I said, it’s a great overview of the last 10 years of Stamen. Or how long does Stamen exist yet, Eric?
ERIC RODENBECK: Since 2001. So gosh, it’s going to be 14 years now. When we started, I thought we only had maybe four or five years before Google came in and the machines took over. Turns out there was a lot more to do.
MORITZ STEFANER: Yes, and there were many really great issues you touched on in your talk, and the one that was really where I got the most curious, and also one that I keep pondering about and discussing with people, is this whole issue if there is a market or let’s say the changing role of creating bespoke data visualizations – very creative, crafty data visualizations – because of course on the one hand it’s the business that I’m in so I have a strong personal interest, and I think there is also something very interesting that happened in that field over these last 15 years.
And obviously Stamen has been a huge part of that, maybe even leading the whole development. So I think that’s the first topic I would really like to discuss with you. How do you see that? Is there still a need for creating highly bespoke and crafty data visualizations? Or do you feel 95 per cent of data visualization challenges maybe can be tackled now in standard tools? What’s your take there?
ERIC RODENBECK: So on the one hand I think about it all the time, and on the other hand I have no answers, only in the sense that it’s so close and personal that it’s almost like I can’t see the whole field because I’m so connected to it. But I think very clearly there is still a need for this. And when I say “this” I mean the creation of these custom experiences. The way that I think about it on a good day is that this is – if you think about data visualization as a technical exercise primarily driven by code, there is clearly a lot less work than there used to be just in the sense that, you know, Plot.ly and Tableau and all these companies and our friends at Carto DB make the kind of basic “get your data visible” much easier. Or Import.io is now doing things like having desktop-based web scrapers and –
MORITZ STEFANER: And when you started out there wasn’t even Google Maps, right? Let’s keep that in mind. Google Maps came only in 2005.
ERIC RODENBECK: Yes, this is all fairly recent stuff. The way I think about what’s been happening is that just because there is a program called Photoshop doesn’t mean that people don’t need to take pictures anymore, and it doesn’t mean that there isn’t a need for highly custom work in this area. Now maybe if you’re somebody who made a living designing blur filters, maybe you need to find something else to do. But I think that the practice of data visualization is about more than the creation of a suite of filters or the creation of tools. I think that if we think about visualization and mapping as a creative field and as a communications field, and as a field that has to do with the kind of communication of information not just kind of in a neutral sense but in a kind of active open sense, then it seems clear to me that there is a whole lot more to do.
MORITZ STEFANER: I tend to agree, absolutely. But at the same time I feel like maybe the whole market is changing and maybe our roles are also changing more. As you say, in the beginning it was even hard to get anything on a map or to do something that’s not a line chart or a bar chart.
ERIC RODENBECK: Much less to get hired for it, right? I mean you had to really explain to people what this stuff is.
MORITZ STEFANER: Right, right. In the beginning I vividly recall the Digg Labs visualizations because they were sort of for me the first time I saw something really unusual from a big company, you might say – not just from an art school. Was it there that – how did these projects develop? Did the clients come and say we want something mind-blowing new? Or did they come and just say let’s see what you can come up with? And how do clients frame projects maybe today? Is there a change, or how did that develop?
ERIC RODENBECK: In this case, it was very much something that was in the mind of Kevin Rose. I mean he was so excited about having basically his finger on the live wire of what was happening on the internet. It was just such an amazing feeling to think that you could kind of in real time get a sense of what kind of news was breaking.
And it was really his vision to have a couple of visualizations that would really shine a light on what was going on, because the front page was just much too quick for anybody to pay attention to. We tried to bring our own vision to that and to come up with our own take on that and then also our own – Kevin, to his credit, was very open to experimentation. And so we came up with multiple other visualization types beyond the first two that he came to us with. So I really have to give him a lot of credit for having that vision and believing in us. He’s a real visionary.
But I would say it’s really a mixed bag as far as how people come to us for this work. I think that 14 years is a long time, and if you look at the kinds of expectations that people have now around data visualizations, it’s just total night and day from what it was before. I can remember going to the New York Times and talking to them about mapping and data visualization and they were really resistant to it. They had this idea that people didn’t understand how to zoom and pan and click on a Google Map. You remember that? And now they’re just, like, doing amazing work. You look at what Shan Carter is doing over there; you look at what Mike Bostock is doing – and it’s being done at the highest level, in real time, as part of a news-making exercise.
So you used to have to explain to people what this was, and now the field has basically just completely opened up. There is a much higher level of sophistication when people are coming to us and asking for this work. It’s not about “can you get our data on the map?” It’s more about “can you communicate this thing that I’m having a hard time communicating, using all of the technology and design tools at your disposal?” – which, to me, is much more interesting.
ENRICO BERTINI: Do you think there is a specific reason why this happened? Is it more – do you think this is due mostly by a technological transformation? Or what?
ERIC RODENBECK: Yes, the technology has gotten much, much easier, but also the set of expectations people bring to it. As my friend Ben Cerveny used to say, the literacy level around this has all gone up, partially as a result of work that we’ve done and very much because of work that people like you are doing, that people like Ben Fry are doing, Casey Reas. All these practitioners have been banging this drum of making data visible for years, and so the market is just more sophisticated than it used to be.
MORITZ STEFANER: Yes, and this development is still going on. And if you think back five years or three years even, as you say, what people expect from data visualization, but also what they know already and what we can all build upon as a pattern or as an established cultural thing, narrative techniques, or, as you say, map UI. We can presuppose that now and do something with it. And a few years ago you had to explain it and experiment.
ERIC RODENBECK: Yes, and so this is in some ways what I was trying to get at in the talk that I gave. What do you do when suddenly the thing that used to be your own special little secret sauce that only you and a few other people knew how to do becomes something very widespread? Do you pack up and go home? Do you find something else to do? Or what else is there?
And I think this is a really good moment for us as practitioners in this field to really kind of step back and take a look at what we’re actually trying to make happen because it’s not just about poking a stick in the eye of the establishment. It’s not just about something that no one has ever seen before. It’s about generating and maintaining real value through this work and becoming a vital part of the conversation about what’s happening in the world. And that’s just very different from uncovering a shiny new thing for the first time and holding it up. There is a lot of freedom and latitude in doing it for the first time. Doing it for the third and fourth time and doing it well and demonstrating mastery is, I think, a different proposition.
MORITZ STEFANER: OK, and it’s a much more long-term and slow and often invisible process, right? So it’s of course much easier to impress somebody with a one-minute video of this beautiful thing, but often it’s much harder to explain why a year-long dialogue with a client was interesting or worthwhile. So do you feel this? Do you feel it’s getting harder to do sexy types of projects or sexy work in that sense – like something that everybody finds immediately compelling?
ERIC RODENBECK: I think I’ll come back to my friend Ben here. He talks about thinking about what we do – and when I say “we” I mean you and we also – less as designing software and more about designing fashion – kind of situating this work less as a kind of, like, I make this tool, then I make this tool, then I’m finished and more about engaging in a practice of making new things within a culture that’s moving forward. So you’re kind of situated both in a kind of technical context and in a creative context but then also in a cultural context. Certain things resonate at different times. It’s less about a kind of quantifiable “this is what’s next” from a development perspective and it’s more about a kind of cultural “this is what’s next” from a kind of societal perspective. And I’m going to say this a bunch: I think it’s a much more interesting time now than it was then. There’s so much more to do.
ENRICO BERTINI: So while watching your talk I was always thinking about is going mainstream a good thing or bad thing. And I think going mainstream, I mean we should celebrate that. I mean we’ve been doing this viz thing for quite many years now. And the fact that it’s going mainstream is probably due to the fact that it’s very successful. But at the same time I think my opinion is that if something goes mainstream, it doesn’t mean that many more good things are going to happen, right? I mean probably there will be a lot of new ideas, new transformations. So probably it’s going to be very exciting anyway. I’m curious to hear what’s your take on that.
ERIC RODENBECK: I’m just thinking about it a lot, not just in terms of data visualization but also in terms of what’s happening to cities. I don’t know if it’s happening in Europe so much, but I know that in the United States we’ve reached this point where cities are going mainstream, where they used to be these kind of edgy places where you moved to as a young person and you helped develop something or you moved to as an artist. And now all the people are here, and it’s getting kind of weird for those of us who have been on the kind of developing edge of cities for a while.
I’m looking around at a lot of these places that I used to think of as kind of hip and edgy, and they’re just kind of not anymore. They’re something else. And I’m not willing to just simply say cities are over or, you know – which no one is saying that cities are over. But I guess what I’m finding in the world to be quite interesting as a kind of zone of discovery is just what happens when – like really what happens when these edgy things become well settled. What is the opportunity there? It might be because I’m getting older and I have a kid and I’m less interested in moving to the next new, hip neighbourhood. But I’m just really starting to think about putting down roots and thinking about having a way of working that works in the long term.
MORITZ STEFANER: I think this gentrification perspective is a really good one. I have never seen it like this, but probably it’s true that, yes, everything fresh and hip and totally edgy and cutting edge, you know, at some point it needs to settle down. And then it’s becoming interesting. Does it just become a watered down version of the original? Or is it actually like a transformation into something just more solid, more sustainable, more reasonable, really – and maybe more grown up, as you say. That’s a good question.
ERIC RODENBECK: Yes, I hope it’s the latter, not the former. But, you know, my kid is going to be 18 at some point and he’ll tell me. I mean something else that’s sort of useful – and I’ve used this as a rhetorical device in other conversations – is, when we’re talking about data visualization as a field that’s changing, to go back to some other field of endeavour, both creative and technical, and just put the word – take the word, say, “photography” out and put “data visualization” in. Or painting, say. And not just to slavishly kind of repeat the past but just to kind of put ourselves in the position of people who were at the transformation of a medium.
And if you look back over the history of technology and the philosophy of technology, you can see these things repeat themselves, right? So people, they literally used to say the same things about photography that we’re saying about data visualization. And they used to have these big arguments about whether it was OK to move a branch aside in the field of view when taking a picture, because photography was about supposedly capturing what was actually real.
So I think it’s worth going back and looking at the history of art criticism because photography just kind of dropped that kind of concern like a bomb, right? And we’re sort of seeing a similar moment in mapping where the things that – it’s so funny; you read these blogs by professional cartographers, and they’re really concerned about the kind of dumbing down of their craft and very concerned that people don’t have the proper focus and they haven’t been trained in the way that color and form need to work together in order to communicate the most optimal message. And you look at some of that work that they’re doing and it’s like – I don’t want to just start being mean to people, but I mean it’s the most boring thing you could think about, right?
[laughter]
ERIC RODENBECK: And yes, it’s true that everybody is like “10 things you can learn from this map” on Buzzfeed, you know, and that kind of crap. But I don’t know. I prefer living in the Buzzfeed world where there’s just so much more volume and so much more action than in this kind of rarefied work that’s only allowed to be done by professionals.
MORITZ STEFANER: Highbrow stuff, yes. It also reminded me – I don’t know if we mentioned it but there is this great text from Michael Naimark on First Word Art / Last Word Art. I can’t recall if we ever discussed it on the podcast, but I have it from Golan Levin, and he passed it around a few times. And I think it matches often so well, and the text just briefly sketches or sort of posits that there’s two great ways to do a great artwork. And the first one is to do something for the first time really well and, like, break that ground and do something radically new. Then there is this other way where you take something existing and try to sort of build on all the culture.
ENRICO BERTINI: Transform it.
MORITZ STEFANER: Yes, and do the definite symphony or write the definite crime story, right? So take something that’s existing and well established and then work within that rich context. And both types are super interesting to work with. And maybe we’re just right in between. Like the first word art has been done in many ways, I guess, in data visualization. Now we need to maybe work on how to take it to the next level really.
ERIC RODENBECK: Well, and then you start to talk about genre, right, like when you start to think about a crime novel or even a novel as a genre. There is a great book by Michael Chabon called Maps and Legends, and he talks a lot about the use of maps and comic books and all these popular forms of writing as a way of exciting people and of getting people just excited about the material that you’re working in.
And you get to a place with a lot of these things where it’s not necessarily about inventing new forms but really inhabiting the ones that exist. And you start to be able to play them off each other. You start to be able to make inside jokes. You start to be able to make progress over time. I mean there is a whole way of thinking about literature that I think if we started to think about – if we started to hold our data visualizations to the same standard as we held our comic books, I think we’d have some wonderful work.
MORITZ STEFANER: That’s true.
ERIC RODENBECK: And my wife has talked about this. Like maybe we do pop-up books of data visualization. You guys can’t steal that idea, but that’s something I want to do at some point is to do a pop-up book.
MORITZ STEFANER: That sounds really nice.
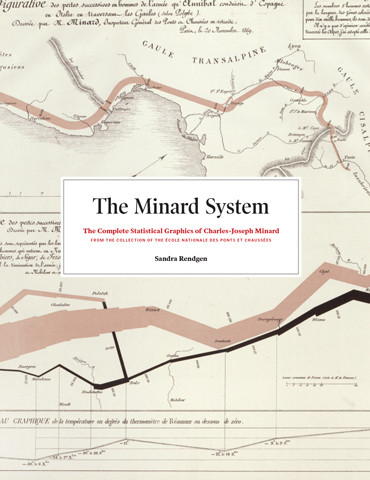
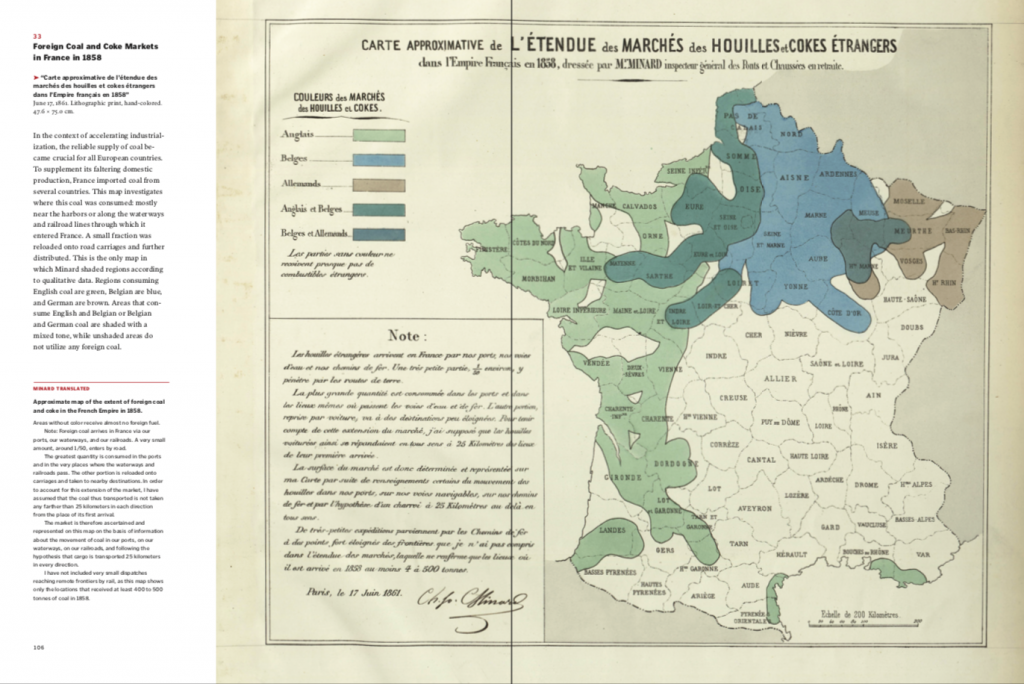
ERIC RODENBECK: And you get, like, Minard and you get, like, Aaron Koblin’s flight patterns and that happens as you open and close the pages of the book. Or Digg labs, like in a pop-up.
MORITZ STEFANER: It’s brilliant. You need to do it. Sounds good.
ERIC RODENBECK: Thanks, man.
MORITZ STEFANER: But the genres is a really, really good idea. And I think there’s even a talk by Martin Wattenberg and Fernanda Viegas. I somehow recall they had something on what if this visualization is the crime story and this is the horror story and this is the love story, right? And what if you build on that and sort of work with these existing genres. It’s really nice.
[Ad: Qlik]
MORITZ STEFANER: How about the practical side? That’s also something I was really interested in. What I keep discussing and also keep figuring out for me, what’s the best way to build data visualization? What’s the best team size? What’s the best methodology? Is it different to build data visualizations process wise than doing media projects in general? Any advice there for anybody getting started? Or what’s your experience now over all these years of doing projects? What are the things from an organization point of view? What didn’t work? I’m super curious to hear all that?
ERIC RODENBECK: So there’s a lot of talk about how to code, Agile software development practices and so on, and I think all that’s super important. And iterative development and scrums and all that kind of thing, I think that that’s good. I guess I would say in my experience I’ve found that if you try and rely on a process, whether it’s rigid or not but it’s sort of defined, you wind up always pointing back to the process and there’s a sort of attempt to take the people out of the equation. And I’ve just never found that to work. I think that if you can find the right project manager, for example, you can be head and shoulders above where you were before. And partially it’s because they have processes, but also it’s because they’re willing to kind of step up and figure out what needs to be figured out. It’s a kind of spirit of being able to make it happen no matter what.
And so when I think about the kind of people that are required to do this work and do it well I think about people who are more friendly and engaged with each other – committed to the craft, certainly, but committed to each other as well. So that’s just as – part of what I’ve been thinking about is how to have a studio that continues to run, a studio that continues to be supportive and not just a kind of flash in the pan, jump in with both feet and then move on kind of place. So it’s just – I’ve talked about it with a number of people. Is it important to have a way of working that is kind of systematized and where you can drop people in and out? And I just don’t feel like that’s a good way to do creative work. And I also just don’t feel like it’s a good way to do the kind of work that’s got staying power.
MORITZ STEFANER: Yes, but I mean at the same time I think there is some character to Stamen projects. I could imagine there is also some repeating patterns in the processes that sort of ensure that the outcome is sound and is also interesting. So how do you do it? Do you, when you have new team members, sit down and show them past projects and tell them how you did them? Or will you coach them in the first few projects they do? Or do you just say you’re cool and you’re cool too – the two of you work together, and keep me updated? Or how do you usually approach this challenge of – I mean you never know how people, if you don’t give them a process, how they will approach the projects, right?
ERIC RODENBECK: I suppose it’s character flaw of mine that I’m much more interested a lot of time in other people’s ideas and responding to their ideas rather than coming in and saying it absolutely has to be done in this way. That can cause problems and strife, but I guess I’ve just always found it more interesting. And it’s part of how I’ve got involved in data visualization. I feel like the world and the data in it is more interesting than any sort of preconceived notions that I’ve had in it. I’m in a process of responding and moulding much more than I am in sort of determining from the beginning.
Having said that, the work needs to get done. And so my project managers and design directors will have a very different sense of this. They’re in the business of teasing out what that process should be and how it ought to be applied. I’m aware that this is somewhat unorthodox and I would – when I start to think about the process of doing this work, I think much more about things like embracing early uncertainty and experimenting and encouraging play. Those are not things that you get to do at Stamen. Those are things that you have to do. That’s a big part of the work.
And really the way that – you know, when we first started doing this I wanted to combine experimental work and commercial work together. You know, I wanted to be like Santiago Calatrava or one of these big shot architects that kind of do experimental works. And what I’ve found is that in this practice the process of open source software development and open data has been a really kind of fertile bridge between these two, and also a way to develop best practices for doing creative data visualization. There’s just been a sense of on the most basic level from being able to share IP with your employees. But then also just the level of commitment that encourages new things and the kind of way of working that’s both experimental and yet has to work is a vital part of the process that’s going on.
MORITZ STEFANER: OK, yes, it’s tricky. Yes, it’s super challenging. And personally for me I never felt I can scale my process over a team of more than two or three people actually. So I felt any time more people were actually deeply involved in the project, like things are getting complicated and are in trouble. Just out of curiosity, how large are the teams in Stamen? Do you also have sometimes projects where you have seven people or 10 in one project, or is it all small, very agile teams?
ERIC RODENBECK: It’s mostly fairly small – you know, three, four. The thing I like to say about Stamen is that if any one of us can do it on their own, it’s not really a Stamen project. I want all of us to be learning from each other and surprising each other. And there’s stuff that the back-end people can do that the front-end people can’t. And there’s stuff that the designers do that the technologists can’t. And we’re all in a situation of always learning from one another.
We’re working on a project right now for the University of Richmond that’s one of the larger projects that we’ve done. And that’s got more than just a few people, it’s got a larger team on it. And it is a challenge to be in a place where the code is not just all in your hands or where the design needs to be handed back and forth a bunch of times. But I’m very much of the mind that collaboration and learning, at least in this context, is better than lone wolf, individual authorship.
MORITZ STEFANER: Yes, and end of the day, many of the big and also worthwhile projects cannot be done by two or three people just hacking something together. I think it’s also something which is just a reality.
ERIC RODENBECK: Yes, and if you’re doing a project about climate change and it needs to be factually accurate and you need to design and build a map of the entire western seaboard, that’s not something that gets done at night and on the weekends because someone is feeling creative, right? It’s something that gets done during the day with people, gets communicated about, goes through revisions – all those kinds of things. I like having things that are subject to scrutiny.
ENRICO BERTINI: And Eric, I wanted to ask you, since you introduced – you just mentioned the climate change project, I was really impressed by the part where you said – I think it’s toward the end of your talk – you say why I’m still here. And I’m really curious to hear – and I mean seriously because I think this is probably one of the most interesting parts for me because I think it’s so easy to just, I don’t know, lose your vision on the day-to-day activities that we all have.
I mean I go to work every single day. I come back home. I have a family. But from time to time I like to stop and think about why am I exactly doing that. And even more, is there a way that I can have some sort of impact on the world with what I’m doing. So I’m really curious to hear from you what’s your take on that because from what you said in the talk it looks to me that you have some ideas about that, right? I mean you must have at least one answer why you’re still there, right? And I think that’s really, really important because this goes very well beyond any problems with – I mean any technicalities, learning this or that, being cool or whatever, right? It’s trying to have a real impact.
ERIC RODENBECK: So the one that springs most to mind is this climate work. There is an urgency that I feel and that scientists have felt for a long time that, I mean, this climate change that is occurring is gigantic and is too abstract a lot of times to be understood. And the people that have the best understanding of it are often the people that aren’t necessarily the best communicators about it because they’ve got their arms around all the facts.
And I think there is an urgency that I feel around conservation, around climate change, around communicating what’s going on on the planet that keeps me up at night. And it’s really important and urgent that we do stuff about this now. And it’s not enough to leave it to the scientists, not enough to leave it to the politicians. There has to be a kind of groundswell of understanding about what’s going on and then also what to do. And so that’s something I’m super motivated by to try and effect some change here.
I think this whole issue of cities and how to live in them is also something that – one of the dominant, if not the dominant issues of our time. When I talk with my partner at Stamen Jen Christensen about this, we both have this sense – and the numbers are showing – that the world is going to – everybody is going to move to cities. There are going to be about 9 billion people in the world. Everything is going to get super dense. And then it’s kind of going to stay that way, right – I mean barring kind of catastrophic stuff. The world’s population is going to max out at wherever it’s going to max out, everyone’s going to be in a city, and then we’re going to have to need to figure out how to live that way.
And so it’s really important that we have dialogue around cities that’s informed by data that’s not just about the kind of connected city, smart city, you know, everybody has got sensors in all the walls kind of conversation; to have a kind of robust conversation about how we want cities to be and how we want to use maps and visuals to communicate about those kind of things. So I’m thinking much less about any particular new software contribution or any new particular kind of design innovation, and I’m starting to really just think about what’s a way to make these processes more human and to make the communication about them more human, more literate, better informed.
ENRICO BERTINI: Yes. So you just mentioned climate change. Do you think there are some other areas that might actually be crucial for data visualization, for having an impact in the world?
ERIC RODENBECK: I think that when this stuff works really well it takes something that is hidden or invisible or complex or difficult and makes it extremely clear. I’m thinking about the work that my friend Wes Grubbs did at Pitch Interactive where they mapped out – it was a visualization of all the drone strikes that the US and our allies have been carrying out in Afghanistan and Pakistan. And it’s just this incredibly impactful, gentle pounding over the head of what’s going on over there. And it really kind of brings to light something that you had never really thought about, or maybe not necessarily never thought about but it brings to the fore and it makes clear and it makes visible something that was previously behind locked doors.
There is a project that James Bridle has put together – Dronestagram. He finds the locations of all of the drone strikes and then he publishes satellite imagery of the places where those things have happened – these kind of very – I don’t even want to call them subtle, but they’re very direct reminders through visuals of what’s happening in the world. And I don’t mean to be overly political. The issue of drones is a quite complicated one, and there’s a lot of things to talk about there. But I just feel like if you can find something that you care about that hasn’t been adequately mapped, that hasn’t been adequately brought to light, I think it’s really worth grabbing on to it with both hands.
We’re doing a project right now about slavery in the American south, and the maps and visualizations that are coming out of that will just chill your soul to think about how many people were forcibly taken from their families and moved around. I feel like these kinds of issues, a lot of times you can read about them, and that’s one thing. And you can be told about them, and that’s another. But if you can be shown them in a way that kind of short circuits your brain and kind of makes a real impact, that’s really good. That’s cool. That’s a good reason to get up in the morning.
ENRICO BERTINI: And I think ultimately this is connected to how people consume this kind of information. So I’m just curious to hear, so when you publish a project on the web, do you have any specific method through which you know exactly how people use your information?
ERIC RODENBECK: We don’t do a whole lot of tracking – I mean a little bit here with Google analytics and that kind of thing. What we’ve done, we make sure that it goes on to Twitter and Facebook and those kind of things. And I watch that quite carefully. There is an energy from having this work out in the world and having it on the internet, especially with hash URLs and things so you can really tell where people are looking so it’s not just they look at the project but they’re looking for Afghanistan or whatever. So really the work there is to put as many kind of hooks into it as you possibly can so that people can kind of refer to it in whatever way they need to.
ENRICO BERTINI: So do you have any success story of people doing something special, taking action after using your applications?
ERIC RODENBECK: You know, I should have a much better answer to this question.
ENRICO BERTINI: I think I remember, for instance, the one about crime. You had a crime one.
ERIC RODENBECK: Yes, that was one that we had heard some really good things about. When we did the crime spotting project, formerly people were showing up to these police meetings and the police were showing them kind of badly photocopied maps and charts about what was happening in the neighbourhood. And after we made the crime data public we heard that people were going to these meetings with their own maps and their own data and asking questions about why there was a rash of burglaries along Solano Avenue and those kind of things. That’s one that’s impactful in people’s brains.
I think the more general issues around climate – you know, for the Audubon project where we map the changing ranges of birds – under circumstances of climate change the anecdotal evidence was kind of similar there. People, really, when you say there’s not going to be any more owls in this forest or we might actually lose the loons in Minnesota, those kind of things are also pretty impactful. You know, if you can show people this is happening at your house, again it makes it a little more – if you can make these issues personal, you can start to have more of an impact.
MORITZ STEFANER: I think that’s a really interesting point and it’s something – I mean we’re all aware now we need to make individual views and the application shareable and build smart mechanisms for actually annotating maybe the data or sharing specific views, but I think there is not enough culture yet to actually ensure that this is happening afterwards or, as you say, understand how it’s happening in detail.
And I think part of the problem as an agency or for me as an individual is it’s just not feasible to follow up on projects years afterwards and sort of train people to use it right or do workshops with the tools. You know you would actually have to keep being part of that conversation, and the client often is probably also not capable, or it depends highly on which types of people you have there if they are in a position to do it even. And I think for years now we’ve been debating that, but I’m not sure if it’s happening in the right way yet.
ERIC RODENBECK: We do a couple of things here. We sponsor an educational initiative called MapTime, and that’s something that if there has been a change in operating in the last couple of years, it’s very much been about this that it’s less about demonstrating virtuosity to a small circle of initiates and more about kind of inviting the broader public into this work. So Beth and Alan at Stamen started this chapter – and Lizzie at CFA – started this chapter where we basically invited people to do very basic map-making work, and it’s expanded now on a volunteer basis. I think there are 40 chapters on four continents where people get together once a week or every two weeks and learn about the basic mapping framework.
And for us that’s been a core of what I’ve been interested in at the shop since we started was kind of making this stuff much more available to regular people and being part of a very mainstream conversation. What’s started to happen is that for certain kinds of clients who are interested in education the fact that we’re going out and fundraising and supporting these educational initiatives has been kind of a selling point almost for us. It’s not just about the work but it’s also about having enough of an infrastructure and enough of a capacity to teach other people about it.
And I’m really interested in that way of working. So it’s not just about doing something and then releasing it and then walking away to something else, but it’s about developing these longer term relationships and having relationships with universities and being able to go out and teach people about this kind of stuff and really be embedded in the conversation in the long term. So I think there’s ways to do it. It’s hard, and it’s not always clear what the path is – and especially the path about how to pay for it is one that I’m actively working on right now. But I’m glad to know that you’re thinking about this as well. It sounds like you’re saying it’s an active topic of conversation among you guys.
MORITZ STEFANER: Yes, I felt so. And I feel we need to take the next leap there because it’s a bit like climate change. Everybody is aware it’s there. It should be tackled. But it requires a change of habits and a change of behaviours and, you know, also for us in how we approach these projects. And I was reminded of that when I read this text by Deb Chachra on making. And she has this great text on The Atlantic why she has trouble identifying with the maker scene. I think it’s specific now this argument to the maker scene, but it can also be generalized that there maybe has been over the last years or so maybe a bit of obsession with people who make stuff and produce stuff that is cool and fancy and awesome and not enough work that’s being valued that actually builds competence or creates communities or all the people side of things, let’s say.
ERIC RODENBECK: Yes, I’m looking at this now, the sort of – “Walk through a museum. Look around a city. Almost all the artefacts that we value as a society were made by or at the order of men. But behind every one is an invisible infrastructure of labor – primarily caregiving, in its various aspects – that is mostly performed by women.” This is huge, you know, and I think that there is this kind of maker culture which is great and wonderful. I think there is also a kind of pizza and beer mentality to a lot of this kind of work where, you know, you show up in your hoodie and you’re of a certain class and you’re able to spend the time hacking on stuff and then you get rewarded –
MORITZ STEFANER: Save the world in a hackathon.
ERIC RODENBECK: Yeah, and so I’m just not – I mean I’m interested in that, sure, and I think it’s great. But, for example, we’ve done work with the San Francisco Museum of Modern Art about working with their API. And they were much less interested in sort of let’s go to some tech office and invite a bunch of dudes to show up and provide them with pizza and beer after hours and more in reaching out to their community and getting involved in the curation process, discussing these things together, turning it into a much more kind of collaborative, let’s see what we can figure out together rather than a kind of lone wolf, see what you can hack up, you know, break things and move quickly kind of thing.
And I think doing having something similar with the Berkeley School of Informatics. They’ve got a whole kind of data in there, and they’re really interested in finding ways to both make their data more available but also give people a sense of what’s possible with it. And I just feel like this whole idea of nurturing and gardening rather than just kind of coming in and moving quickly and breaking things is another aspect to data visualization and the field and the culture that I want to nurture.
MORITZ STEFANER: Do you think this is also the long term trajectory for Stamen as a company as a whole, or do you think there will always be this mixture of, maybe, making and community building. Probably it has always been like that, or do you see the weight shifting there, or what’s your feeling?
ERIC RODENBECK: I don’t know – I can’t speak to what’s happening in the world. I can speak to what my personal interests are, and I’m at a place where I’m certainly interested in encouraging the making and the breaking but not to the exclusion of the growing and the nurturing. I’m really interested in, for example, gender parity at Stamen and this kind of idea that it’s not just about – I mean you look at Silicon Valley and it’s just disgusting. It’s just, like, 90 per cent men or whatever. It’s just gross. And it’s so clear. And it’s just – anyway, I’m very interested in a working model that encourages both sides of our humanity – or all sides of our humanity, I should say, not to be so heteronormative.
MORITZ STEFANER: I think the Maptime project is really interesting too, and Enrico and I have also been talking about visual literacy and how to get more people to do the data part and be excited about data analysis and data science – things like this. What do you think is the biggest gap we need to fill? What is the big obstacle? I mean the tools seem to be there. The people seem to be interested. It’s a sexy topic. What do you think? What do we need to sort of bridge?
ERIC RODENBECK: It is a sexy topic. I’m not sure that there are obstacles so much as there are challenges now. I think it’s about engaging, finding other people who have a similar mindset. And I think we’re starting to find them, you know, in the foundation world. We’re starting to find them in the education world. I think it’s about being very intentional about that, about wanting to move the field in that direction. One of the things that I’ve learned is you get the kind of work that you’ve already done, and if you don’t ask for something, you won’t get it. So part of what I’m trying to do is to be very public about this desire that we have at the studio to build a technological and creative practice that’s more inclusive, less about, if I may, a kind of bro culture of Silicon Valley and more about a sustainable way of doing business and being in the world.
ENRICO BERTINI: I’m very much interested in the educational part of viz as well. And I think when we talk about visual literacy I think we implicitly mean the idea of teaching people how to create visualizations or deal with data. But I think there is also another aspect. How do we actually expect people just to read this thing correctly or just be able to reason through data?
MORITZ STEFANER: Draw the right conclusions and so on.
ENRICO BERTINI: Yes, exactly. And I don’t know. My impression is the more people will be exposed to visualizations or anything that comes out of things like data journalism, the more they will realize that – I mean they will be pretending more information about whatever is, I don’t know, thrown at them, right? I think we come from a very long time of journalism where people just take facts as they are. And probably, I don’t know, in a bright future people will be able to – first of all they will be pretending more information, not just taking everything for granted. And I don’t know. I think that’s an interesting trend. I hope it’s true.
ERIC RODENBECK: Well, if you think about – again, I think this why I think it’s a good idea to switch out the words “data visualization” with other practices, right? Because, for example, journalism now is in crisis in the sense that people don’t believe that there is any one single truth anymore and that there is a sort of wilful obstruction of the facts. And you look at what happens with climate change where the facts simply don’t matter and the fact that in some ways we are living in our bright future, right, where everybody is literate, everybody can read, and everybody has access to the internet, and in some ways it’s a shambles because everything is just kind of fragmented and everybody has got their own reality.
So I want to be careful not to make claims for data visualization that just because there is going to be – I just think we have to be really careful because we don’t want to go down that same road of, like, just because people are more visually literate doesn’t mean the world gets any better. I think we – especially when we were first, as a practice, starting to get our legs underneath us, in the whole field of data visualization there was this sense that if you could just make the data clearer, everything else would fall into place.
And what that doesn’t do is address power, is address, you know, politics – any of the kind of real world, messy problems. So for me the issue now is less how to make all the data much clearer but how to use that new found clarity in the world, with the world, engaged with the world and the processes that happen and to make good things happen. And I think it’s actually worth being explicit about that, because we haven’t as a field.
ENRICO BERTINI: And one thing I’m always wondering is also I remember in the early days of the internet there was a lot of talking about digital literacy or something like that. And I think actually there was a big divide. You can actually find large segments of the population that was illiterate. And I’m wondering if in the future we will have this problem with data literacy. We might actually see that some parts of the population are not literate enough. And there might actually be a big divide there.
ERIC RODENBECK: Definitely. We’ve got to work on that.
ENRICO BERTINI: Absolutely, yes. I had a similar discussion, I think, in the previous episode with Moritz – the idea of trying to teach something already to kids because they’re probably ready to learn a lot of these things. I don’t know if you have any experience –
MORITZ STEFANER: It should start in school, right.
ENRICO BERTINI: Yes, they should start in school ideally.
ERIC RODENBECK: Yes, I have a three year-old boy and I have a number of atlases for children. And it’s just when he comes to me and says: papa, will you read a map with me –
ENRICO BERTINI: It’s awesome.
ERIC RODENBECK: Papa, can we look at maps together?
MORITZ STEFANER: That’s nice.
ENRICO BERTINI: We should write something about how to teach viz to kids. That would be really, really great.
ERIC RODENBECK: I know, man. It’s so cool. And why not, you know?
ENRICO BERTINI: OK, I think we should wrap it up, right?
MORITZ STEFANER: Cool, that was fantastic. Thanks so much, Eric.
ENRICO BERTINI: Thanks a lot.
ERIC RODENBECK: OK, thanks you guys. Nice talking to you.
ENRICO BERTINI: Thank you. Bye.
[music]
[Ad: Qlik]

 Our TOPPODCAST Picks
  Stay Connected


 Data design systems and styleguides are currently a huge trend in the data design world. Moritz is joined by
 Finally, this year we managed to record another classic episode from the IEEE VIS Conference (we recorded a total of 10 with this one!) We have Data Stories’ friend Prof. Tamara Munzner with us to talk about the conference and to highlight a few things she picked from the many events that happened over this week-long event.


 This week, we are joined by






























 We have data visualization freelancer and old friend-of-the-podcast
 [Please remember that Data Stories is fully listener-supported! Please consider






 It’s a whole new year! Consider


 In this episode, we have artist and sculptor

 [If you enjoy our show, consider
  [If you enjoy our show, please consider
  *** SUPPORT US ON PATREON! If you enjoy our show, consider


 It seems almost impossible right?! And yet, here we are with our 100th episode! Data Stories has been around for more than five years and now we mark this big milestone.
 In this episode we are joined by
  In this episode Moritz meets
  In this episode we have
 This week, we have Elijah Meeks on the show to talk about the state of data visualization jobs in the industry.
 [Hey friends, help us fund the show by donating to








 We have
  We have
 Hey! Welcome back from summer vacation! We start the new season with an experiment. In this episode, we review three talks that were given at the


 We have Matt Daniels on the show, the “




















 He wrote the very interesting Disinformation Visualization piece for Tactical Tech’s Visualizing Information for Advocacy and we decided to invite him to discuss the million different facets of disinformation through visualization.


